Tweezer Top Candlestick Pattern – What Is And How To Trade
Learn all about the Tweezer Top candlestick pattern. What is, how to trade, and all the best trading strategies.

The "Tweezer Top" candlestick pattern is an important technical analysis tool used across stock, futures, and forex markets. This article provides a detailed explanation of the Tweezer Top pattern, including its definition, identification methods, variations, and various trading strategies to help investors improve decision-making accuracy and success rates.
Definition of Tweezer Top
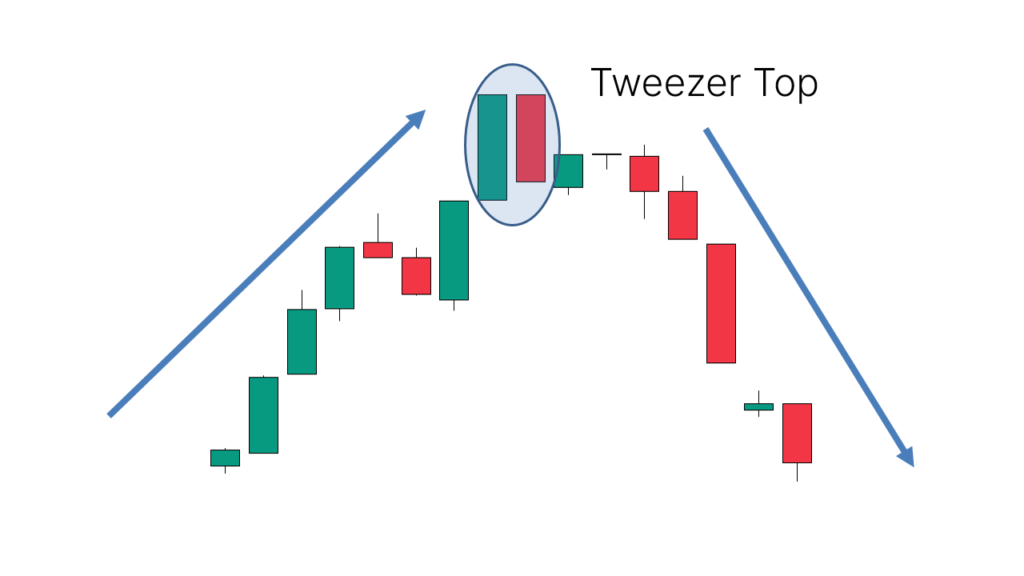
The Tweezer Top is a Japanese candlestick pattern that typically appears at the end of an uptrend, indicating market rejection of higher prices and signaling a potential bearish reversal. When the Tweezer Top pattern appears after an uptrend, it often suggests a forthcoming price decline, marking a trend reversal.
Characteristics of Tweezer Top
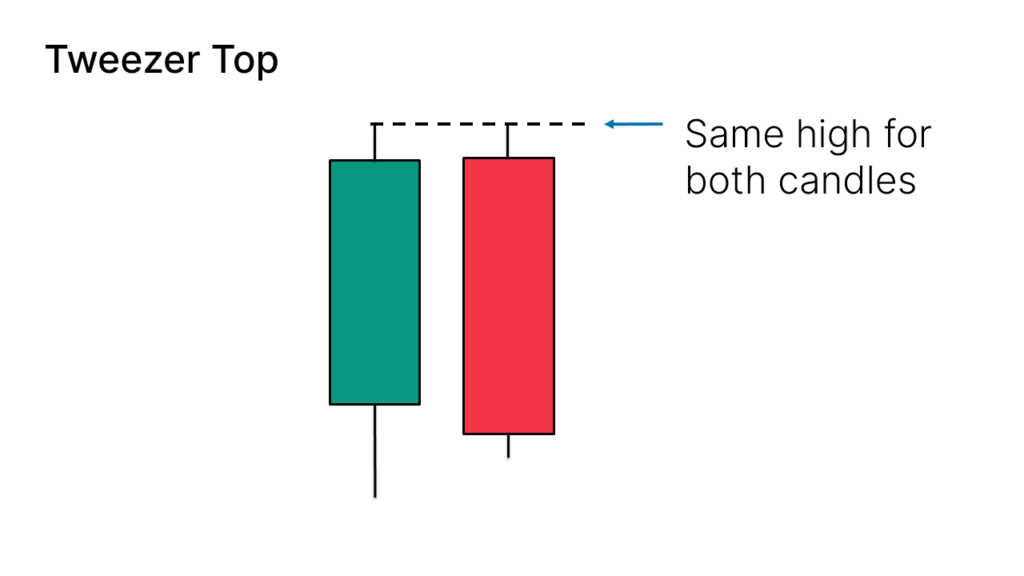
- Formed by Two Candles: The first candle is a bullish candle, and the second candle is a bearish candle.
- Equal High Points: The highs of both candles should be approximately at the same level.
- Example Illustration:
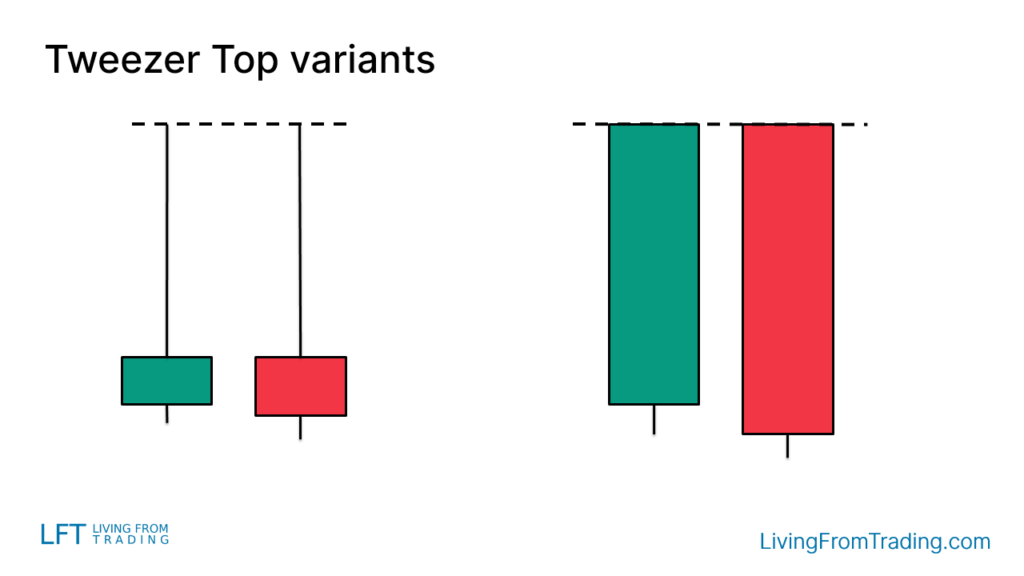
Variations of Tweezer Top
The Tweezer Top pattern may appear differently on charts:
- Candles with Long Upper Wicks: Similar to the Shooting Star pattern.
- Candles with No Wicks: Similar to the Bearish Engulfing pattern.
How to Trade Tweezer Top
To trade the Tweezer Top, it is essential not only to identify the pattern but also to consider its position:
- Pattern Occurrence: The price must first rise; the appearance of the Tweezer Top signals a bearish reversal.
- Entry Point: Consider shorting when the low of the last candle is broken.
- Stop-Loss Setting: A common stop-loss method is to set it on the opposite side of the pattern.
Tweezer Top Trading Strategies
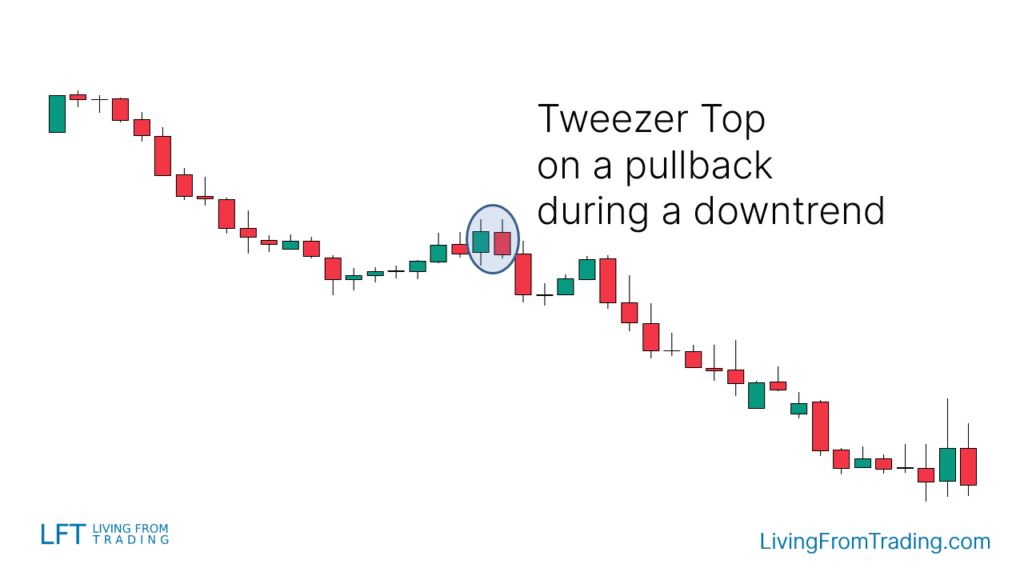
Strategy 1: Pullback Trading on Naked Charts
In a downtrend, the Tweezer Top pattern serves as a significant bearish signal. Investors should wait for a pullback and then short when the Tweezer Top appears.
Implementation Steps:
- Identify Downtrend: Ensure the price is in a downtrend.
- Wait for Pullback: Observe the pullback phase.
- Confirm Pattern: Verify the Tweezer Top pattern at the end of the pullback.
- Execute Trade: Short when the low of the second candle is broken and set stop-loss and take-profit levels.
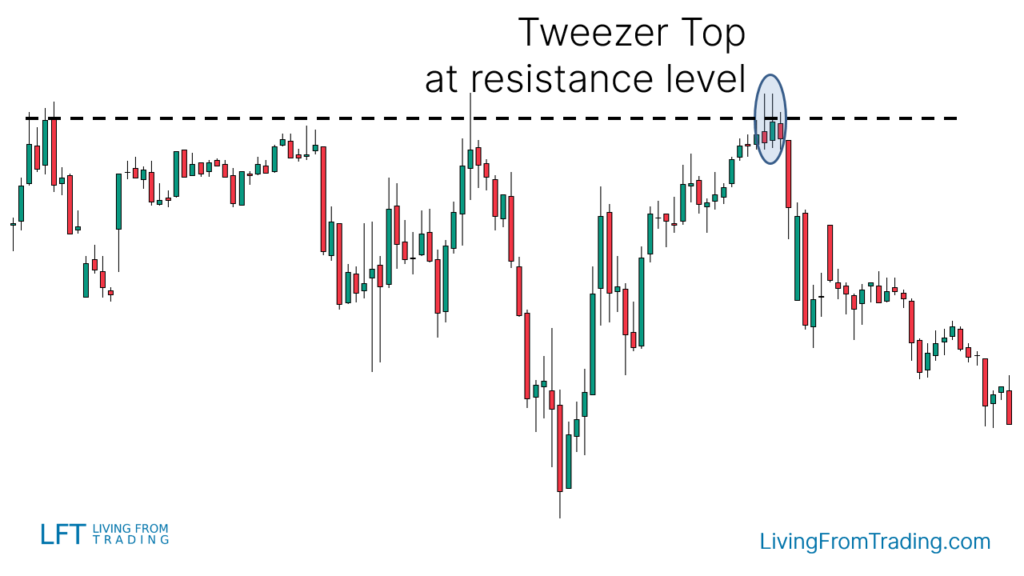
Strategy 2: Trading with Resistance Levels
Support and resistance levels are crucial for identifying price reversals. Consider shorting when the Tweezer Top appears at a resistance level.
Implementation Steps:
- Mark Resistance Levels: Draw resistance levels on the chart.
- Wait for Price to Hit Resistance: Observe if the price reaches the resistance level.
- Confirm Pattern: Look for the Tweezer Top at the resistance level.
- Execute Trade: Short when the low of the last candle is broken, and set stop-loss and take-profit levels.
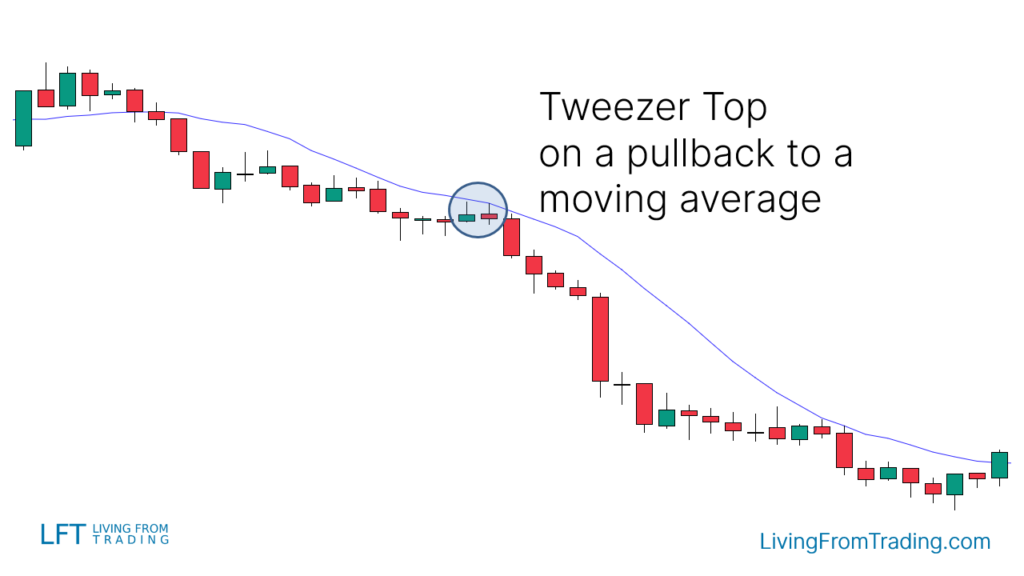
Strategy 3: Trading with Moving Averages
Moving averages help in trading trends. Wait for the price to pull back to a moving average and short when the Tweezer Top appears.
Implementation Steps:
- Identify Downtrend: Ensure the price is below the moving average.
- Wait for Price to Rebound: Observe when the price rises to the moving average.
- Confirm Pattern: Look for the Tweezer Top at the moving average.
- Execute Trade: Short when the low of the last candle is broken, and set stop-loss and take-profit levels.
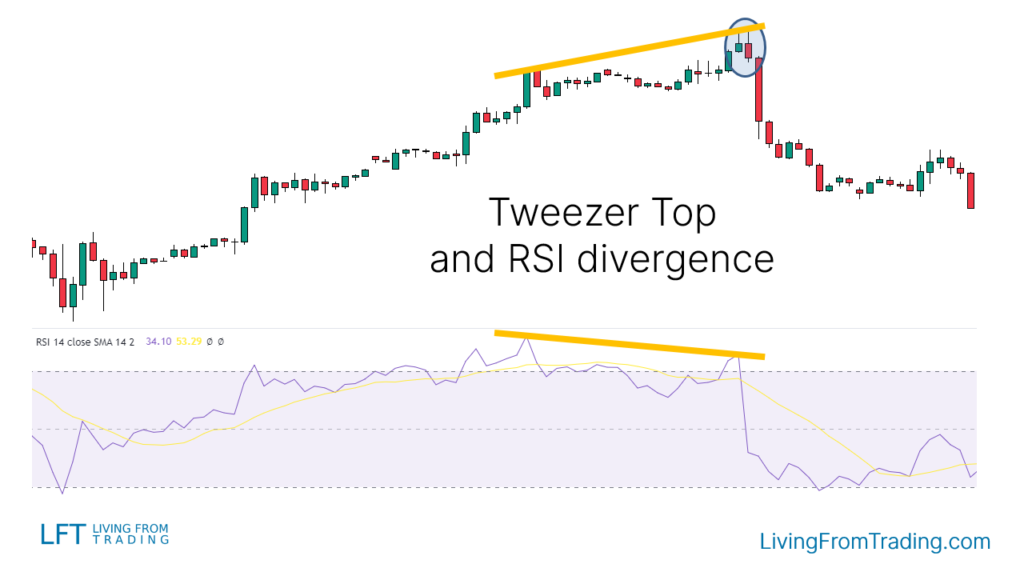
Strategy 4: Trading with RSI Divergences
RSI divergences provide a different approach. Look for bearish divergences when the RSI fails to make new highs while the price does.
Implementation Steps:
- Identify Uptrend: Mark the price highs.
- Compare with RSI: Check if RSI makes lower highs while price makes higher highs.
- Confirm Divergence: Wait for a Tweezer Top at a higher price high aligned with RSI divergence.
- Execute Trade: Short when the low of the last candle is broken, and set stop-loss and take-profit levels.
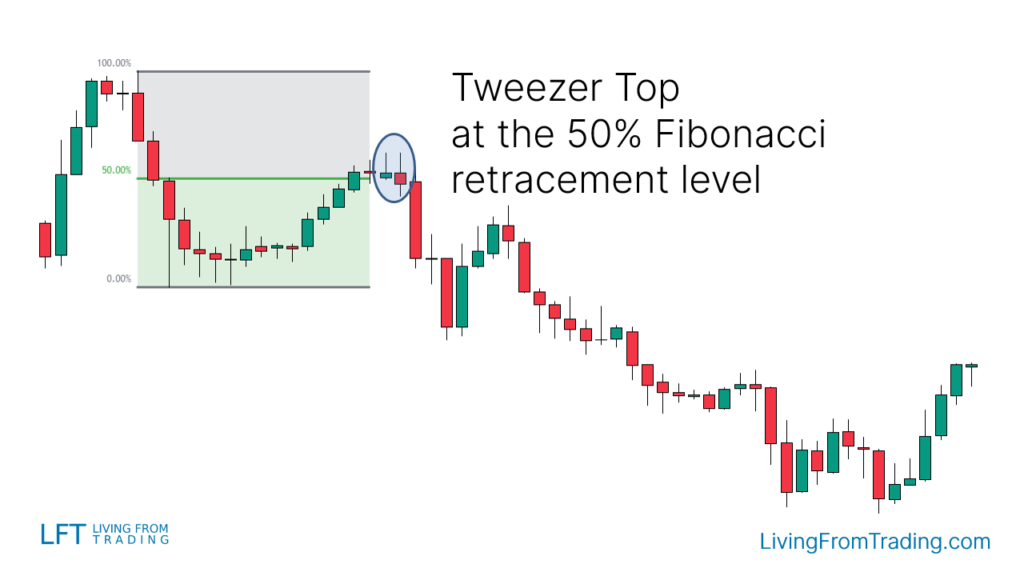
Strategy 5: Trading with Fibonacci Retracements
The Fibonacci retracement tool indicates frequent price reversal levels. Short when the price hits a Fibonacci level and forms a Tweezer Top.
Implementation Steps:
- Draw Fibonacci Levels: Mark significant Fibonacci levels on the chart.
- Wait for Price to Reach Fibonacci Level: Observe price behavior at the Fibonacci level.
- Confirm Pattern: Look for the Tweezer Top at the Fibonacci level.
- Execute Trade: Short when the low of the last candle is broken, and set stop-loss and take-profit levels.
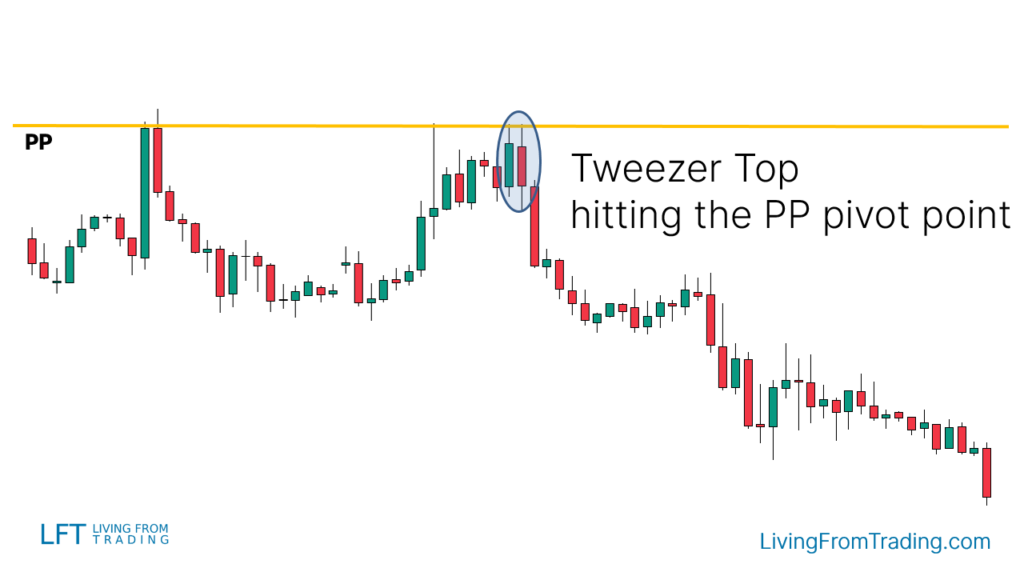
Strategy 6: Trading with Pivot Points
Pivot Points are automatically calculated support and resistance levels. Short when the price hits a Pivot Point and forms a Tweezer Top.
Implementation Steps:
- Activate Pivot Points Indicator: Use the indicator on your chart.
- Identify Resistance Pivot Points: Look for Pivot Points above the price.
- Confirm Pattern: Check if Tweezer Top appears at the Pivot Point resistance.
- Execute Trade: Short when the low of the last candle is broken, and set stop-loss and take-profit levels.
Summary
The Tweezer Top pattern is a crucial bearish reversal pattern in technical analysis, typically appearing at the end of an uptrend. Investors should wait for additional market signals to confirm a price reversal and combine this pattern with other technical indicators for improved accuracy and effectiveness.
Disclaimer: The views in this article are from the original Creator and do not represent the views or position of Hawk Insight. The content of the article is for reference, communication and learning only, and does not constitute investment advice. If it involves copyright issues, please contact us for deletion.