Falling Window Candlestick Pattern - What Is And How To Trade
Learn all about the Falling Window candlestick pattern.What is, how to trade, and all the best trading strategies.

The "Falling Window" is a Japanese candlestick pattern used to identify the continuation of a bearish trend in the market. As a bearish continuation pattern, it helps traders predict further declines in market prices. Below is a comprehensive analysis of the "Falling Window" candlestick pattern and its related trading strategies.
What Is the “Falling Window” Candlestick Pattern?
The "Falling Window" is a widely used candlestick pattern in technical analysis that indicates the likelihood of a continued market decline. This pattern typically appears after a price drop, showing a period of consolidation and a rejection of higher prices. Specifically:
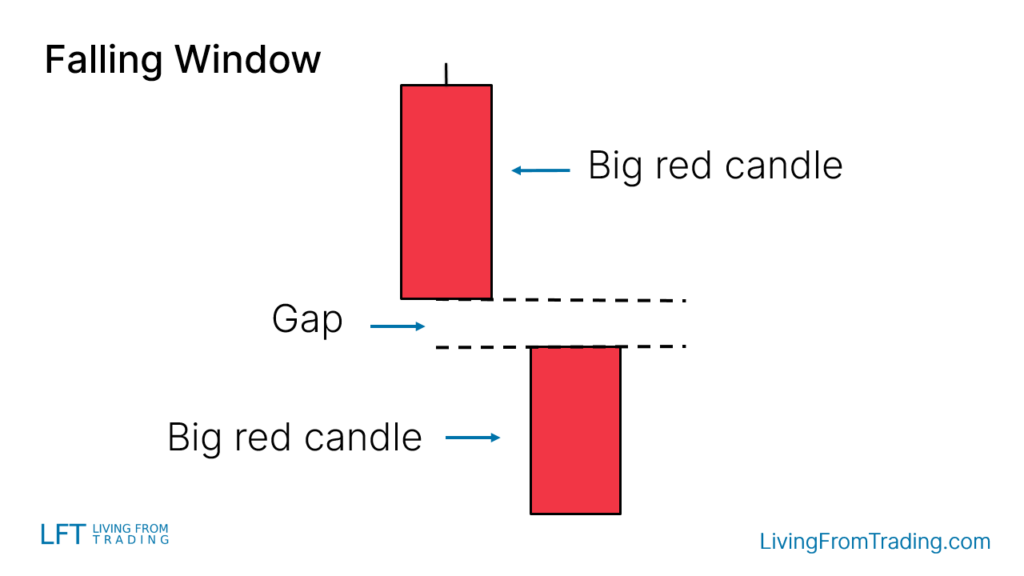
- Characteristics: The pattern consists of two candlesticks: the first is a large bearish candle, and the second is also a large bearish candle with a noticeable price gap between them.
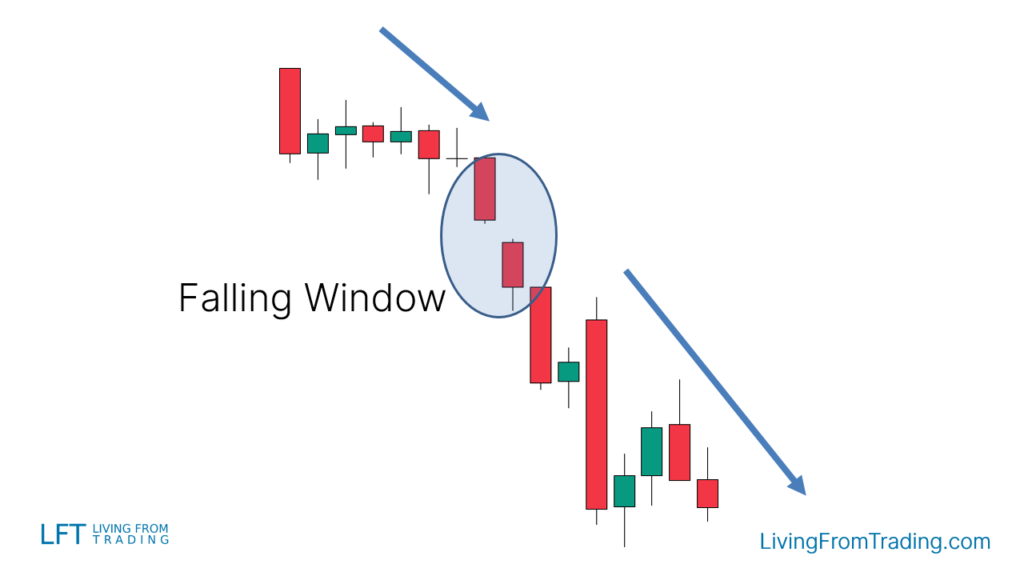
- Implication: It is a bearish continuation pattern suggesting that after the formation of the "Falling Window," the market may continue to decline.
How to Identify the “Falling Window” Candlestick Pattern?
To identify the "Falling Window" candlestick pattern, the following conditions must be met:
- Two Large Bearish Candles: The pattern consists of two large bearish candles. The opening price of the first candle is higher than the opening price of the second candle, and the closing price of the second candle is lower than the low of the first candle.
- Price Gap: There is a noticeable price gap between the two candles, indicating a sharp price movement in a short time.
How to Trade the “Falling Window” Candlestick Pattern?
Trading the "Falling Window" pattern involves not only identifying the pattern but also considering its position and market context. Here is a detailed explanation of trading strategies:
-
Determine the Trend:
- Ensure that the market is in a downtrend before the "Falling Window" appears. The validity of this pattern is based on its indication of the continuation of the trend.
-
Entry Timing:
- Conservative Entry: Consider shorting when the low of the last candlestick in the "Falling Window" pattern is broken.
- Pullback Test: Another strategy is to wait for a price pullback to test the gap. Although this might miss some entry opportunities, it allows for a better entry price.
-
Setting Stop-Loss:
- Common Stop-Loss Method: Set the stop-loss on the opposite side of the "Falling Window" pattern, i.e., above the pattern.
- Risk Management: Ensure a reasonable stop-loss is set to guard against adverse market movements.
Trading Strategies for the “Falling Window” Candlestick Pattern
1.Naked Graph Callback Strategy
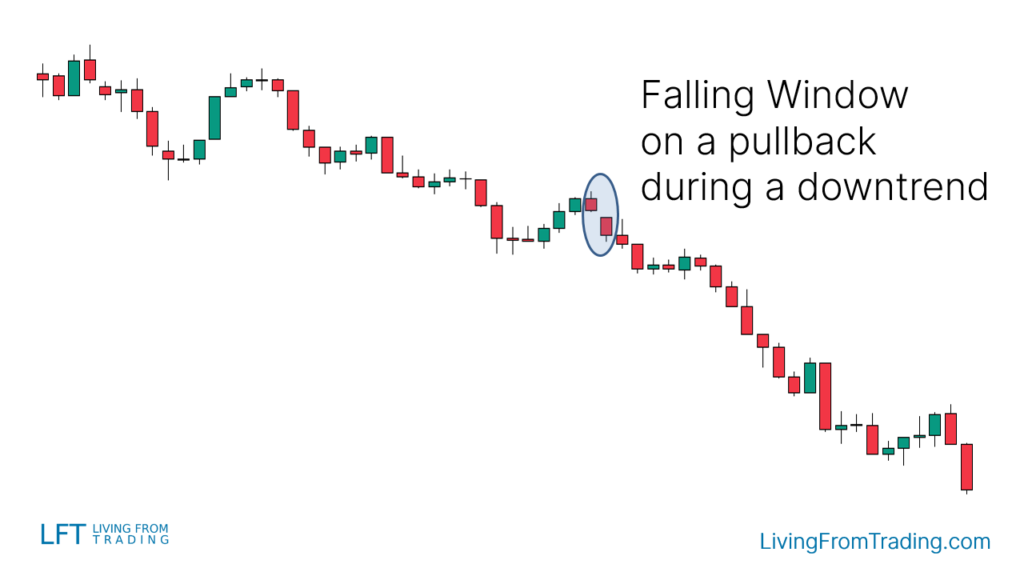
- Strategy: Wait for a price pullback to the position where the "Falling Window" occurred during a downtrend. This pullback usually signals the start of a new leg in the downtrend.
- Example: In a downtrend, when the price pulls back and forms a "Falling Window," consider shorting.
2.Combined with support level trading
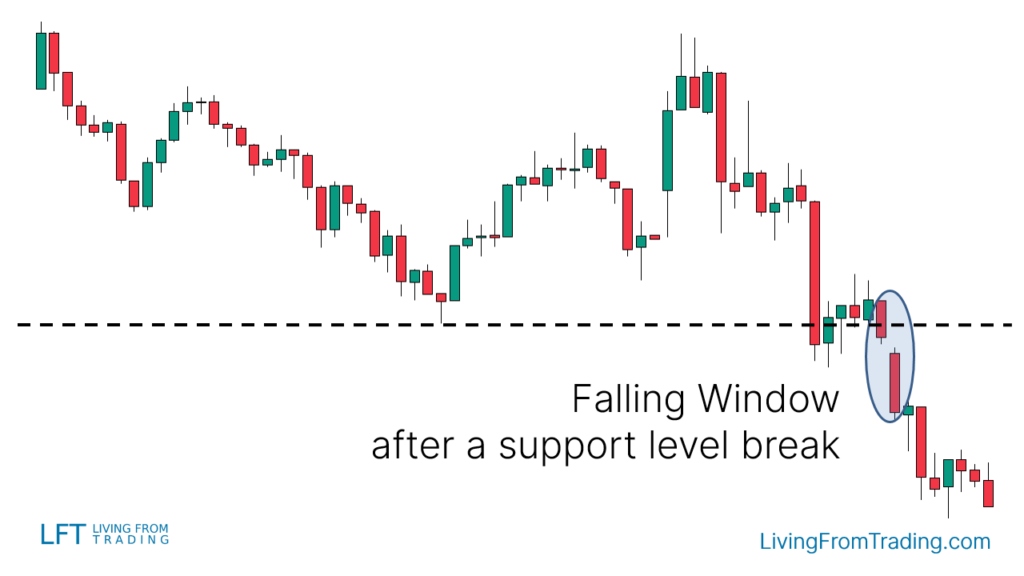
- Strategy: Consider shorting when a "Falling Window" appears near a support level. The ideal entry point is after the support level is broken and tested.
- Steps:
-
- Mark the support levels on the chart.
- Wait for the price to break the support level and test it.
- Short when a "Falling Window" appears at the support level.
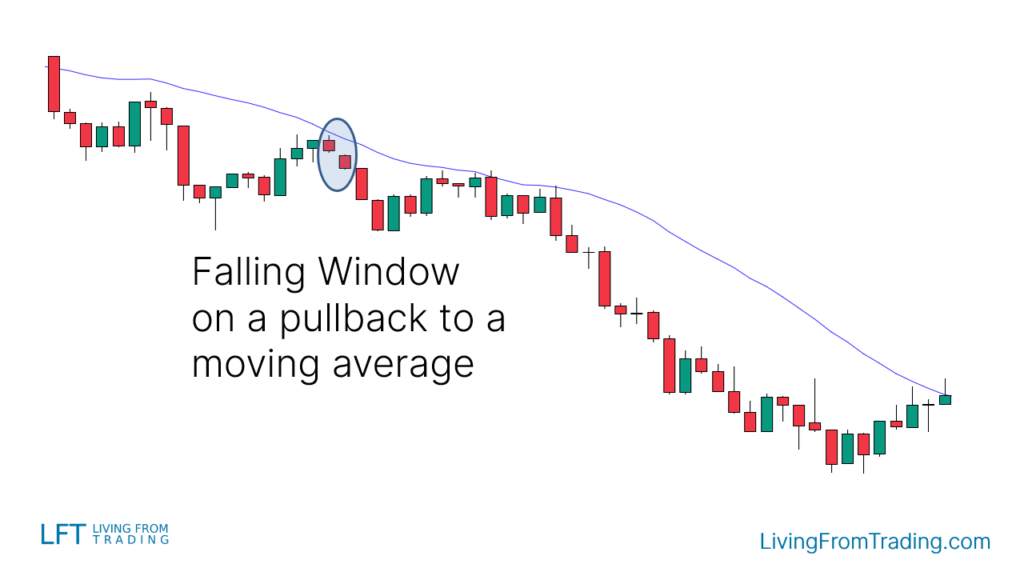
3.Combined Moving Average Trading
- Strategy: In a downtrend, when the price rebounds to the moving average and forms a "Falling Window," consider shorting.
- Steps:
-
- Confirm that the market is in a downtrend and observe the interaction between the price and moving averages.
- Short when the price rebounds to the moving average and forms a "Falling Window."
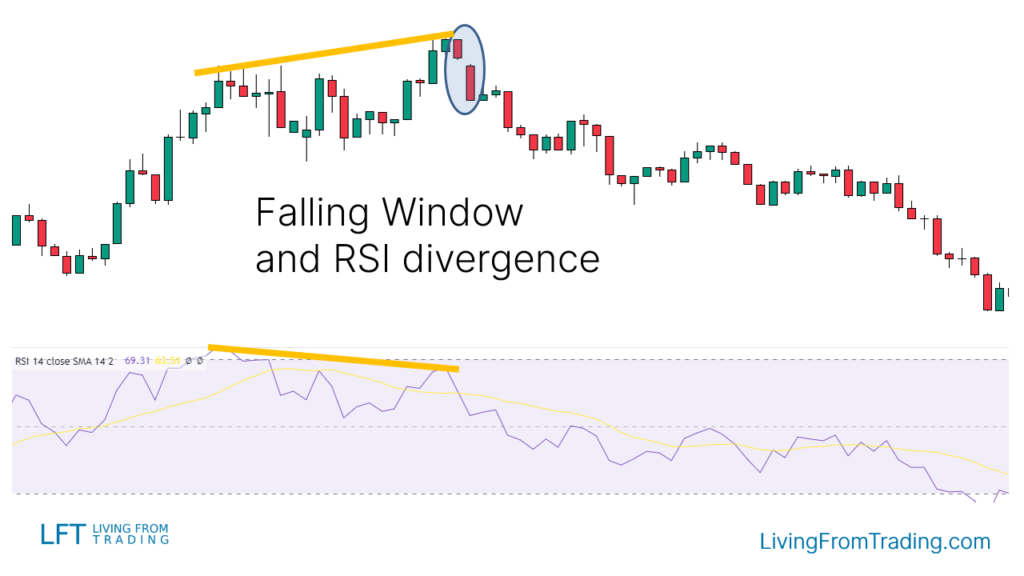
4.Combined with RSI Deviation Trading
- Strategy: Use the RSI indicator to find divergences between price and RSI, especially when the price makes new highs in an uptrend but RSI does not.
- Steps:
-
- Identify the uptrend and mark high points.
- Short when RSI shows divergence and the price high point forms a "Falling Window."
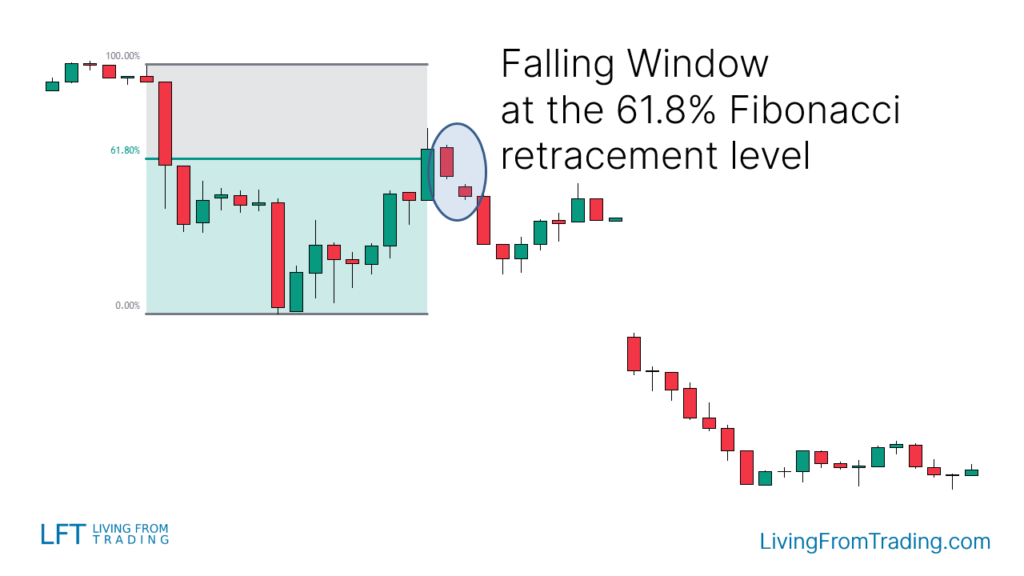
5.Combined Fibonacci Drawdown Tool Trading
- Strategy: Use Fibonacci retracement levels to confirm price pullback areas. Short when a "Falling Window" appears at a Fibonacci retracement level.
- Steps:
-
- Apply the Fibonacci tool to draw retracement levels in a downtrend.
- Short when the price touches a Fibonacci retracement level and forms a "Falling Window."
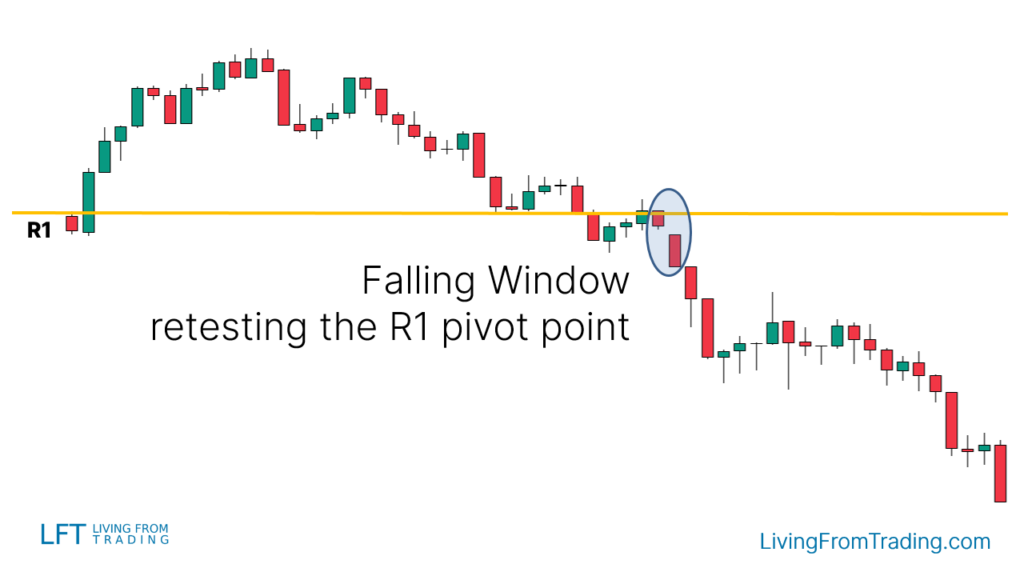
6.Combine Pivot Points deal
- Strategy: Use Pivot Points as support and resistance levels. Short when the price touches and breaks Pivot Point levels and forms a "Falling Window."
- Steps:
-
- Activate the Pivot Points indicator.
- Observe the price and Pivot Points relationship and short when a "Falling Window" forms in a downtrend.
Conclusion
The "Falling Window" is a strong bearish continuation signal that helps traders make more precise trading decisions in a downtrend. By combining this pattern with technical indicators such as pullbacks, support levels, moving averages, RSI divergence, Fibonacci retracement, and Pivot Points, traders can improve their trading accuracy.
Disclaimer: The views in this article are from the original Creator and do not represent the views or position of Hawk Insight. The content of the article is for reference, communication and learning only, and does not constitute investment advice. If it involves copyright issues, please contact us for deletion.