Unraveling PEG: A Key Instrument for Investment Decision-Making
This article will introduce the definition of the Price/Earnings-to-Growth (PEG) ratio, its formula calculation, its relationship with the Price/Earnings (P/E) ratio, usage considerations, and misconceptions.
When assessing whether a company's stock price is expensive, investors commonly use multiple indicators, with the most common being the Price/Earnings (P/E) Ratio. However, the P/E Ratio alone cannot fully reflect a company's growth potential. Therefore, another indicator that objectively measures the relationship between stock price and future growth, the Price/Earnings-to-Growth Ratio (PEG), has emerged.
This article will introduce the definition, calculation formula, usage considerations, misconceptions of PEG, and explore how to find PEG through financial websites.
What is the Price/Earnings-to-Growth Ratio (PEG)?
The Price/Earnings-to-Growth Ratio (PEG), invented by British investment guru Jim Slater and widely promoted by American securities investment master Peter Lynch, focuses not only on stock price but also incorporates the company's growth prospects into evaluation. This allows investors to more comprehensively assess the investment value of stocks.
The Relationship Between the Price/Earnings Ratio and the Price/Earnings-to-Growth Ratio
While the Price/Earnings Ratio primarily measures whether a stock price is cheap, it overlooks the company's growth potential. When the P/E Ratio is low, investors may perceive the stock price as low, but they cannot assess the company's future growth potential. At this point, the PEG combines the P/E Ratio and the expected growth rate to provide investors with a more comprehensive investment reference.
According to Peter Lynch, when a company's P/E Ratio is equal to its expected growth rate, i.e., PEG is 1, it indicates that the company's valuation is reasonable. A PEG greater than 1 may suggest that the stock price is overvalued, while a PEG less than 1 may indicate that the stock price is undervalued.
The Calculation Formula of Price/Earnings-to-Growth Ratio (PEG)
The formula for calculating PEG is as follows:
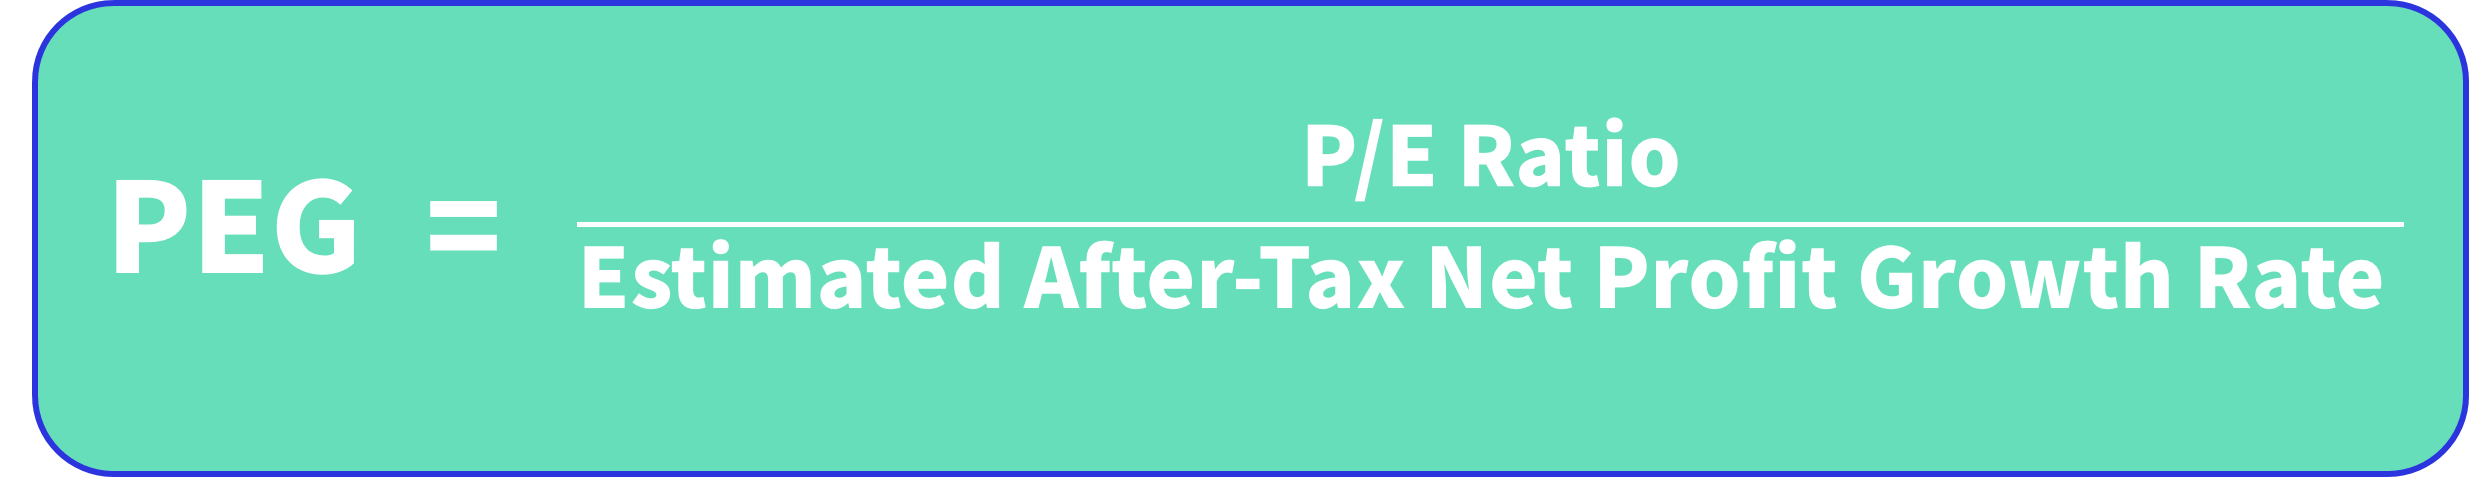
Where the after-tax net profit growth rate is an estimated value, and the P/E Ratio can be calculated using the following formula:

For example, let's assume Company A:
- Stock Price: $100
- Earnings Per Share (EPS): $5
- After-Tax Net Profit Growth Rate: 20% (estimated)
This indicates that Company A's stock price is at a reasonable valuation.
Case Study
Let's assume Company B:
- Stock Price: $80
- EPS for this year: $2.07
- EPS for last year: $1.43
Comparing with a company in the same industry, Company C:
- Stock Price: $90
- EPS for this year: $3.54
- EPS for last year: $3.06
In comparison, Company B has a lower PEG, even less than 1, indicating higher growth potential.
Interpreting the PEG Metric: Exploring Stock Valuation Levels
In investment analysis, the Price/Earnings-to-Growth Ratio (PEG) is a crucial metric used to assess whether a company's stock is undervalued or overvalued. The basic rule of thumb is that when the PEG is less than 1, it suggests undervaluation, while a PEG greater than 1 implies overvaluation.
However, the market has a more refined set of standards for evaluating PEG. Specifically, when the PEG is less than 0.75 or even below 0.66, it is considered an excellent buying opportunity. Conversely, when the PEG exceeds 1.2, it may indicate overvaluation, prompting investors to reevaluate their positions.
The following are recommendations based on the corresponding PEG values:
- PEG greater than 1.2: Indicates severe overvaluation, suggesting selling.
- PEG equals 1: Suggests reasonable valuation, recommending holding.
- PEG less than 0.75 (or below 0.66): Signifies significant undervaluation, recommending buying.
The overarching principle here is that a PEG less than 1 may indicate undervaluation, equal to 1 signifies fair valuation, and greater than 1 may imply overvaluation. Therefore, investors can use the PEG metric to assist in assessing the valuation of stocks and make corresponding investment decisions.
These refined standards help investors more accurately evaluate the valuation levels of stocks, enabling them to make wiser choices in investment decisions.
Using PEG: Considerations and Misconceptions
Considerations:
- Suitable for Growth Stocks Only: PEG is suitable for companies with positive Price/Earnings (P/E) ratios and positive earnings per share (EPS), meaning companies that are growing. For companies with stagnant growth or in decline, PEG may not be as applicable.
- Lower Isn't Always Better: A PEG ratio that is too low may indicate high short-term volatility in the company, increasing investment risk. Especially during periods of significant market fluctuations, a temporarily low PEG value may occur due to transient factors, which may not necessarily reflect the company's long-term investment value.
- Consider P/E Ratio Holistically: Although PEG is an advanced version of the P/E ratio, they have different meanings. It is advisable to consider both simultaneously to obtain a more comprehensive investment perspective. Focusing solely on PEG may overlook some fundamental valuation factors, leading to erroneous investment decisions.
Misconceptions:
- Selecting Declining Companies: Market news affects stock prices, but may not immediately reflect in the post-tax net profit growth rate, leading to a decrease in PEG. Therefore, solely relying on PEG may misjudge the company's situation. For example, when a company releases negative news and the stock price drops, causing the P/E ratio to decrease, while the post-tax net profit growth rate is not adjusted promptly, the PEG temporarily decreases, leading investors to mistakenly believe the company is undervalued.
- Difficulty in Accurately Estimating Post-Tax Net Profit Growth Rate: Growth rate is an estimate, and estimates may vary among individuals. Therefore, different analysts may have significantly different PEG valuations for the same company, affecting the accuracy of investment decisions.
- Few Entry Points: Finding stocks with a PEG ratio less than 1 can be challenging, potentially causing investors to miss out on quality stocks. For example, Apple Inc. (NASDAQ: AAPL) has had an average PEG of 2.13 over the past five years, but its stock price has continued to rise, indicating that PEG is not suitable as the sole criterion for entry timing. Relying solely on PEG may cause investors to miss out on some companies with good growth prospects but higher PEG ratios.
By paying attention to these considerations and avoiding these misconceptions, investors can use the PEG metric more effectively, improving the accuracy and effectiveness of their investment decisions.
Conclusion
The Price/Earnings-to-Growth Ratio (PEG) is an effective tool for evaluating stock value, helping investors make more comprehensive judgments on investment targets by combining the P/E ratio and the company's growth rate. However, PEG is not the only investment decision criterion, and it is recommended to combine it with other financial indicators for comprehensive analysis to obtain the most objective investment judgment.
When using PEG, investors should pay attention to its scope and limitations, avoiding reliance on a single indicator for investment decisions. Through multidimensional analysis, investors can more accurately assess the potential value of stocks and find the most ideal investment targets.
·Original
Disclaimer: The views in this article are from the original Creator and do not represent the views or position of Hawk Insight. The content of the article is for reference, communication and learning only, and does not constitute investment advice. If it involves copyright issues, please contact us for deletion.