Bearish Harami Candlestick Pattern - What Is And How To Trade
Learn all about the Bearish Harami candlestick pattern.What is, how to trade, and all the best trading strategies.
Bearish Harami is an important candlestick pattern used to identify potential market reversals. This article provides a comprehensive overview of the Bearish Harami, including its definition, identification methods, variants, trading strategies, and success rate.
What is the Bearish Harami Candlestick Pattern?
The Bearish Harami is a Japanese candlestick pattern that signifies a bearish reversal. It typically appears after a price uptrend and indicates rejection from higher prices. As a reversal pattern, it suggests that the market may reverse downward, marking the end of an uptrend. The Bearish Harami is essentially the mirror image of the Bullish Harami pattern.
How to Identify the Bearish Harami Candlestick Pattern?
The Bearish Harami consists of two candles:
- First Candle: Must be a large bullish (upward) candle.
- Second Candle: Must be a small bearish (downward) candle, which is entirely contained within the body of the first candle.
On charts, the Bearish Harami pattern looks like this:
_2547380402_18.png)
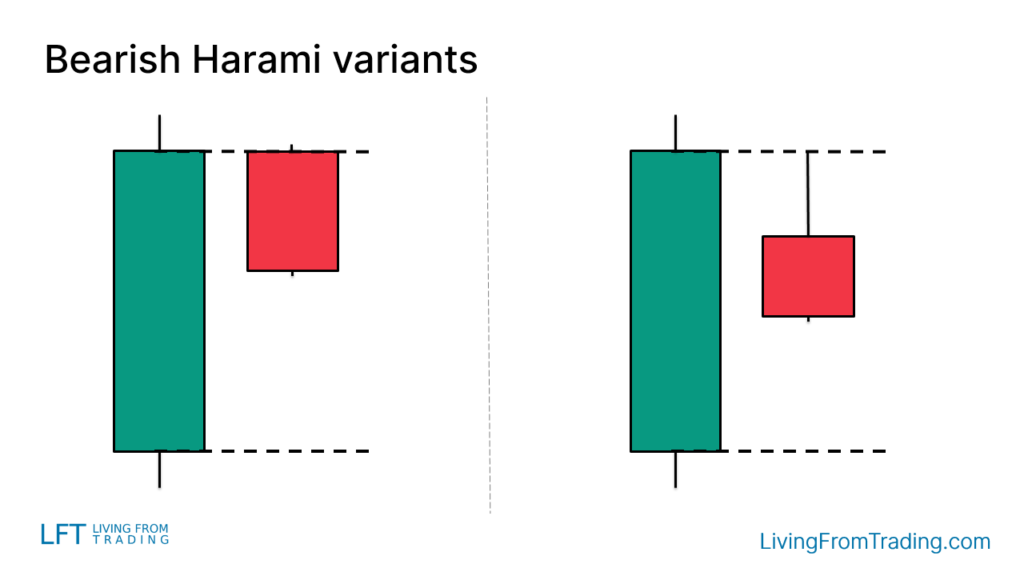
Variants of the Bearish Harami Candlestick Pattern
The Bearish Harami may appear with some variations:
- No Gap: The second candle may not have a gap from the previous candle.
- Long Wick: The second candle may have a longer upper wick.
Here’s what it might look like on your charts:
How to Trade
Trading effectively with the Bearish Harami pattern involves more than just recognizing the candlestick shape; its validity depends on the context and location where the pattern appears. Here are the key factors to consider:
- Market Uptrend: The Bearish Harami should appear after a price uptrend, indicating a potential reversal to the downside.
- Trigger Trade: Enter a short position when the low of the second candlestick is broken. Set a stop-loss on the opposite side of the pattern to protect against adverse price movements.
_2547377159_872.png)
Trading Strategies
Trading the Bearish Harami involves more than just identifying the pattern's shape; its location and market context are crucial. Here are some recommended trading strategies:
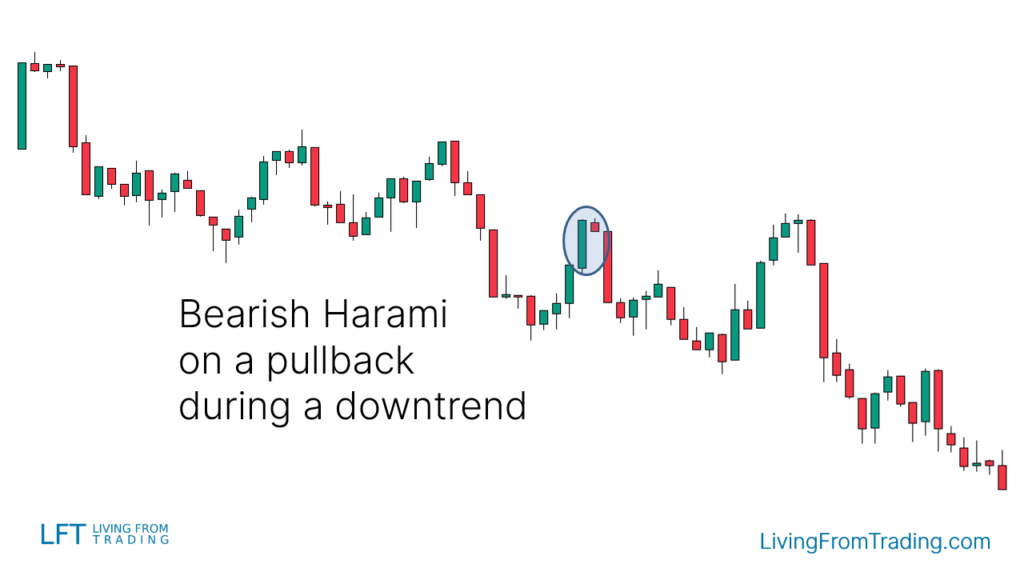
Strategy 1: Pullbacks on Naked Charts
When trading with Bearish Harami, look for it during a downtrend:
- Observe Pullbacks: Wait for a pullback and then spot the Bearish Harami.
- Confirm Signal: Bearish Harami often signals the end of a pullback and the start of a downtrend.
- Position: Enter a short position when the price breaks below the low of the Bearish Harami’s second candle.
- Stop Loss: Set the stop loss above the Bearish Harami pattern to manage unexpected price movements.
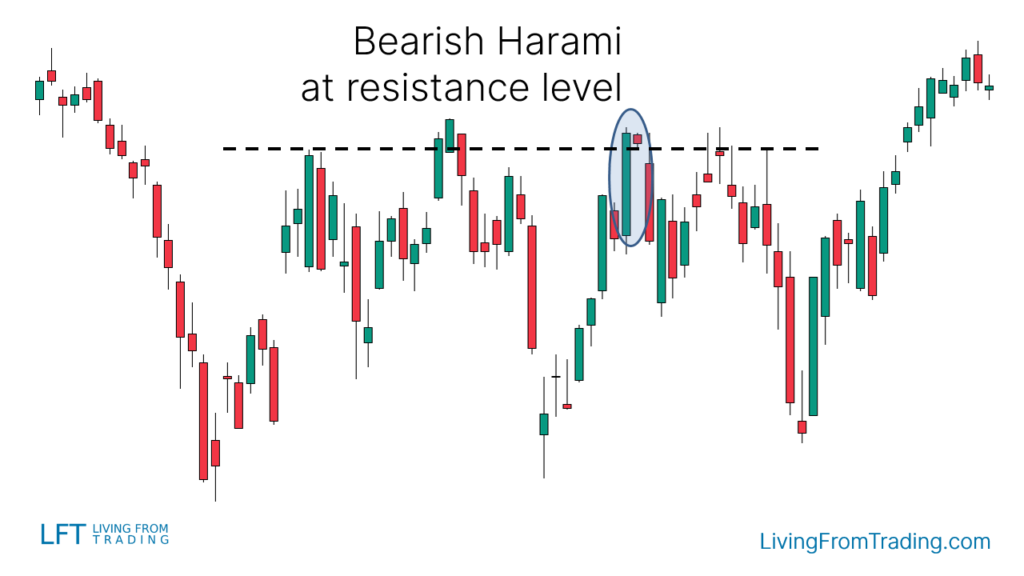
Strategy 2: Trading with Resistance Levels
Resistance levels are key points for finding price reversals:
- Draw Resistance Levels: Mark major resistance levels on your chart.
- Price Hits Resistance: Wait for the price to rise and reach the resistance level.
- Bearish Harami Appears: Look for Bearish Harami at the resistance level.
- Position: Short when the price breaks below the low of the Bearish Harami’s second candle.
- Stop Loss and Take Profit: Set stop loss above the resistance level and define take profit targets.
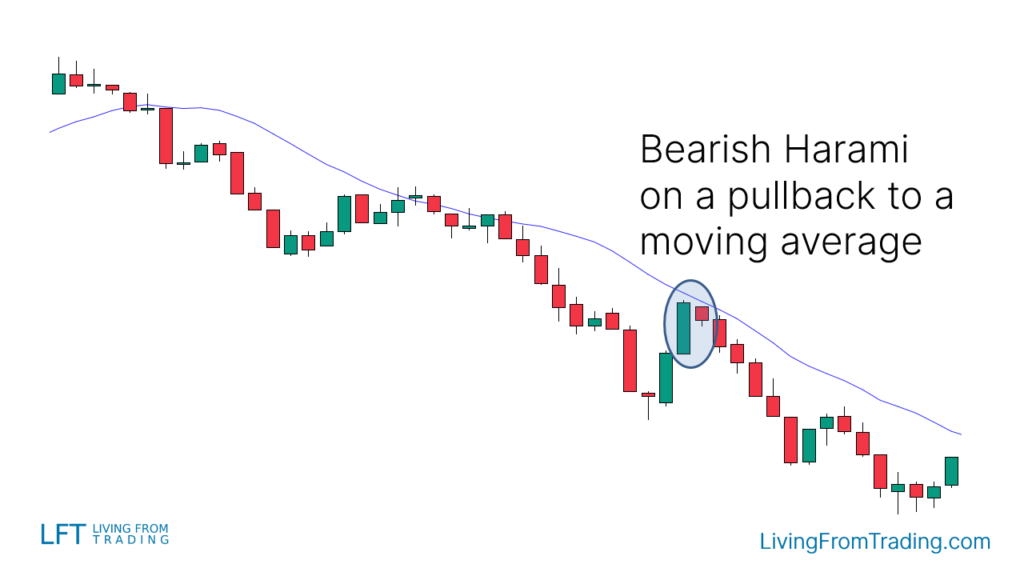
Strategy 3: Trading with Moving Averages
Moving averages can help confirm trends and reversal signals:
- Identify Downtrend: Ensure the market is in a downtrend, with price below the moving average.
- Price Reaches Moving Average: Wait for the price to rise to the moving average.
- Bearish Harami Appears: Look for Bearish Harami at the moving average.
- Position: Short when the price breaks below the low of the Bearish Harami’s second candle.
- Stop Loss: Set stop loss above the moving average and establish take profit levels.
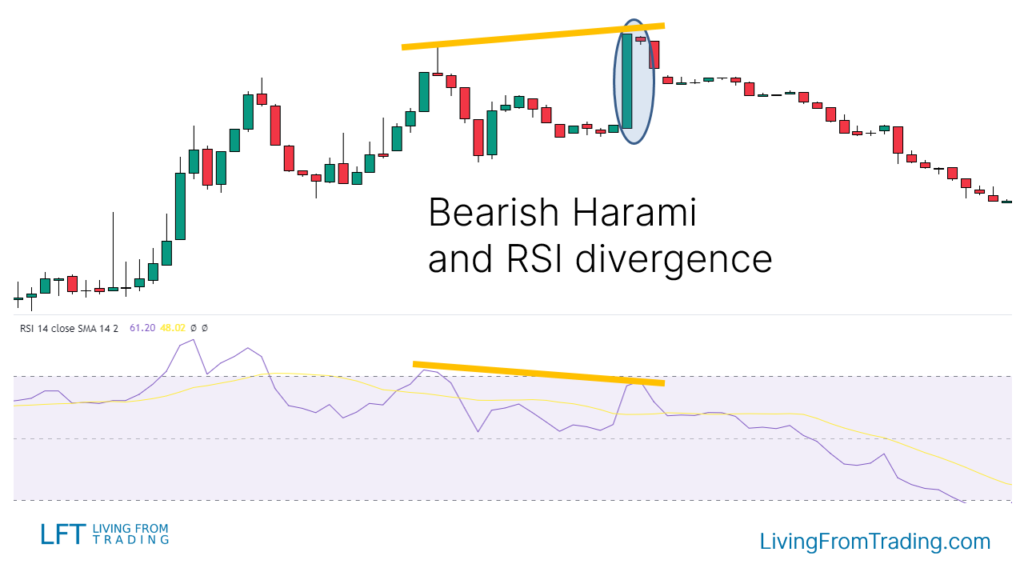
Strategy 4: Trading with RSI Divergences
RSI divergence can confirm Bearish Harami signals:
- Identify Uptrend: Confirm the market is in an uptrend.
- Observe Price and RSI: Mark the highs of the price and compare with RSI highs.
- Divergence: Look for cases where RSI makes lower highs while the price makes higher highs.
- Bearish Harami Appears: Enter a short position when Bearish Harami appears at a price high aligned with RSI lower highs.
- Position: Short when the price breaks below the low of the Bearish Harami’s second candle.
- Stop Loss and Take Profit: Set stop loss above Bearish Harami and define take profit targets.
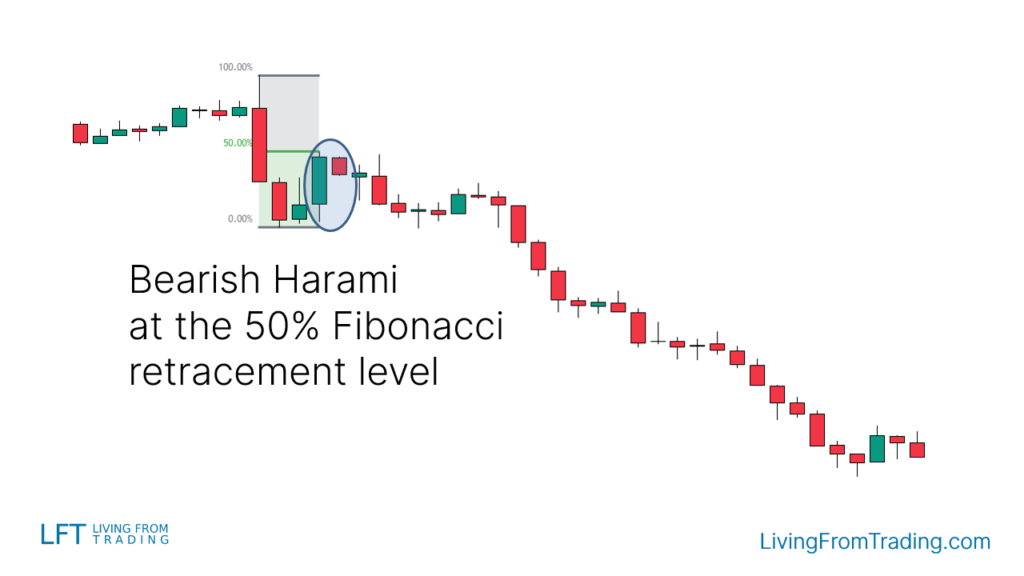
Strategy 5: Trading with Fibonacci Retracement
Fibonacci retracement levels help in identifying reversal points:
- Identify Downtrend: Ensure the market is in a downtrend or starting a new one.
- Draw Fibonacci Levels: From the high to the low of the move, draw Fibonacci retracement levels.
- Price Hits Fibonacci Level: Wait for the price to hit a Fibonacci level and form a Bearish Harami.
- Position: Short when the price breaks below the low of the Bearish Harami’s second candle.
- Stop Loss: Set stop loss above the Fibonacci level and establish take profit levels.
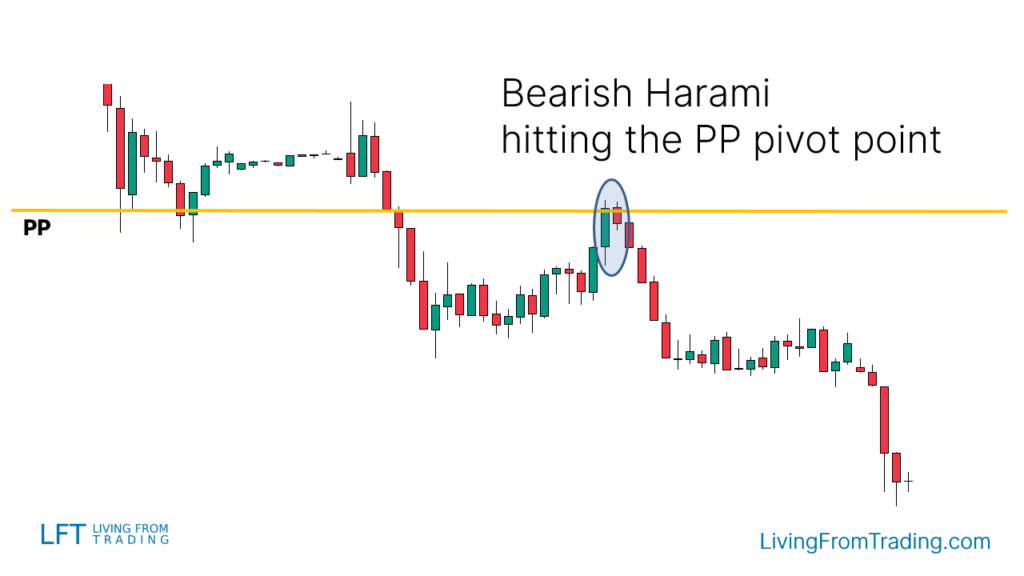
Strategy 6: Trading with Pivot Points
Pivot Points are calculated support and resistance levels:
- Activate Pivot Points Indicator: Add the Pivot Points indicator to your chart.
- Identify Key Pivot Points: Find Pivot Points above the price, which may act as resistance.
- Price Reaches Pivot Point: Wait for the price to rise to a Pivot Point level.
- Bearish Harami Appears: Look for Bearish Harami at the Pivot Point level.
- Position: Short when the price breaks below the low of the Bearish Harami’s second candle.
- Stop Loss and Take Profit: Set stop loss above the Pivot Point and define take profit levels.
Summary
The Bearish Harami is a crucial bearish reversal pattern, ideal for identifying potential downward reversals after an uptrend. Combining the Bearish Harami with strategies involving pullbacks, resistance levels, moving averages, RSI divergences, Fibonacci retracement, and Pivot Points can enhance trading accuracy. Despite a success rate of 53%, effective use of Bearish Harami can improve trading outcomes with accurate technical analysis and well-defined trading strategies.
Disclaimer: The views in this article are from the original Creator and do not represent the views or position of Hawk Insight. The content of the article is for reference, communication and learning only, and does not constitute investment advice. If it involves copyright issues, please contact us for deletion.