US confirms Q1 growth slowdown Gold violence rebounds
A string of weak economic data ignite interest in gold bulls.
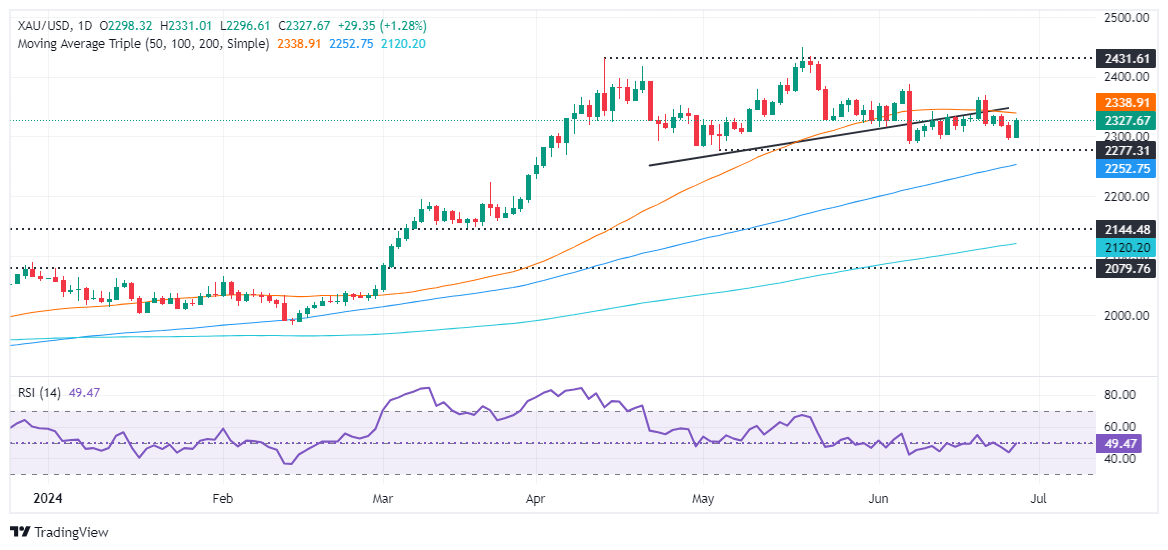
In the early Asian session on June 28, spot gold fluctuated narrowly. On Thursday, influenced by a weaker dollar, international gold prices violently rebounded by 1%, closing at $2327.33 per ounce.
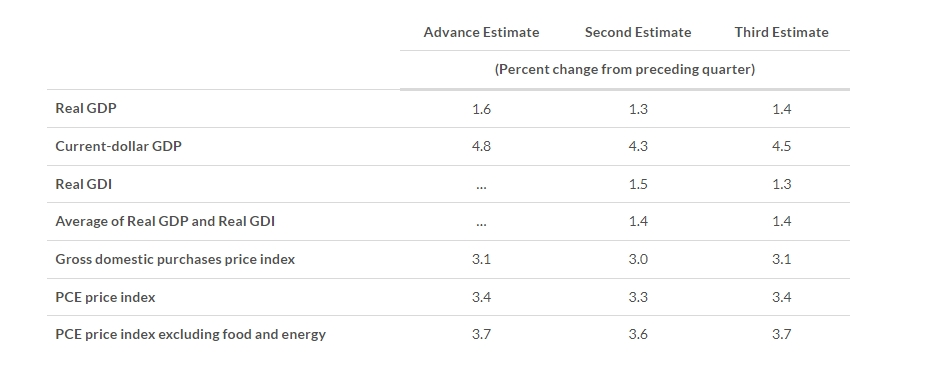
On the data front, on June 27, the US Department of Commerce released the final Q1 GDP figures, confirming a significant slowdown in economic growth for the first quarter. Specifically, the annualized quarter-on-quarter final value of the US Q1 real GDP was 1.4%, slightly revised up by 0.1 percentage points from the revised value of 1.3%, down from 3.4% in Q4 last year, marking the slowest growth rate in nearly two years.

A surge in imports and a decline in business inventories were the main drivers of the data decline. Imports reduced Q1 growth by 0.82 percentage points, while inventory reductions dragged GDP down by 0.42 percentage points.
Additionally, the core PCE, which the Federal Reserve closely monitors, was slightly revised up, but the overall PCE slowed significantly. Data shows that the annualized quarter-on-quarter growth of the US Q1 PCE was 1.5%, below the expected value and the previous value of 2%; the final value of the core PCE, excluding food and energy, rose by 3.7%, slightly revised up by 0.1 percentage points from the previous value of 3.6%. Analysts suggest that the prolonged high interest rates in the US may be impacting the economy.
Due to the lower-than-expected final Q1 GDP and suppressed PCE data, the dollar fell by 0.33% during Thursday's session, closing at 105.92, with the 10-year Treasury yield dropping to 4.289%, increasing gold's appeal.
On the other hand, there was bad news from the US labor market. According to yesterday's data, although the number of initial jobless claims in the US decreased last week, continued claims in mid-June jumped to the highest level in two and a half years. The US Department of Labor reported that for the week ending June 22, the number of initial state unemployment claims fell by 6,000 to 233,000, seasonally adjusted.
However, the reporting period for initial claims included the new public holiday on June 19. Generally, around public holidays, the number of unemployment claims tends to fluctuate, and some economists believe there is no need to overinterpret this data. That said, continued claims for the week ending June 15 increased by 18,000 to a seasonally adjusted total of 1.839 million, the highest level since late November 2021. The US labor market is gradually loosening.
Thursday's data also showed that the US pending home sales index unexpectedly fell to a record low in May, with rising mortgage rates and high home prices deterring potential buyers. The National Association of Realtors (NAR) reported that the pending home sales index fell by 2.1% to 70.8, the lowest level since 2001.
At the same time, new orders for US manufactured goods unexpectedly declined in May, indicating weaker business equipment spending in Q2. Orders for core capital goods excluding aircraft and military hardware fell by 0.6% month-on-month in May, the largest drop this year.
A series of weak economic data sparked interest among gold bulls. Phillip Streible, chief market strategist at Blue Line Futures, said that some of the released data supported the gold market, mainly due to lower-than-expected wholesale inventories and a significant drop in the final GDP value, which lowered the dollar index and boosted gold prices.
Regarding the future trend of gold prices, FXStreet analyst Christian Borjon Valencia said that as the head and shoulders pattern remains intact, it suggests that gold prices may further decline. Although gold prices rose on Thursday, they have not yet challenged the neckline of the head and shoulders pattern. A decisive break above the neckline could negate the pattern and pave the way for gold prices to test the June 21 high of $2368 per ounce.

The relative strength index (RSI) is below the 50 midline, indicating momentum favors sellers.
Valencia stated that the next support level for gold prices would be $2300 per ounce. A sustained break below this level could see prices fall to the May 3 low of $2277 per ounce, followed by the March 21 high of $2222 per ounce. If these levels are breached, gold prices could fall further, with sellers targeting the head and shoulders pattern target of $2170-$2160 per ounce.
Conversely, if gold recovers to $2350, it will look towards higher key resistance levels, such as the June 7 cycle high of $2387 per ounce. Once this resistance is overcome, gold prices will challenge $2400 per ounce.
·Original
Disclaimer: The views in this article are from the original Creator and do not represent the views or position of Hawk Insight. The content of the article is for reference, communication and learning only, and does not constitute investment advice. If it involves copyright issues, please contact us for deletion.