White Marubozu Candlestick Pattern - What Is And How To Trade
Learn all about the White Marubozu candlestick pattern.What is, how to trade, and all the best trading strategies.
White Marubozu is a Japanese candlestick pattern that signals a bullish reversal. It typically appears after a price decline, indicating a rejection of lower prices. Because this pattern suggests a potential rebound from low levels, it is considered a bullish signal. The White Marubozu pattern is also the mirror image of the Black Marubozu pattern.
How to Identify a White Marubozu Candlestick Pattern?
A White Marubozu candlestick pattern consists of a single candlestick with the following characteristics:
- A single bullish candle
- A large real body
- Little to no upper and lower shadows
_56057858_275.png)
Variations of the White Marubozu Candlestick Pattern
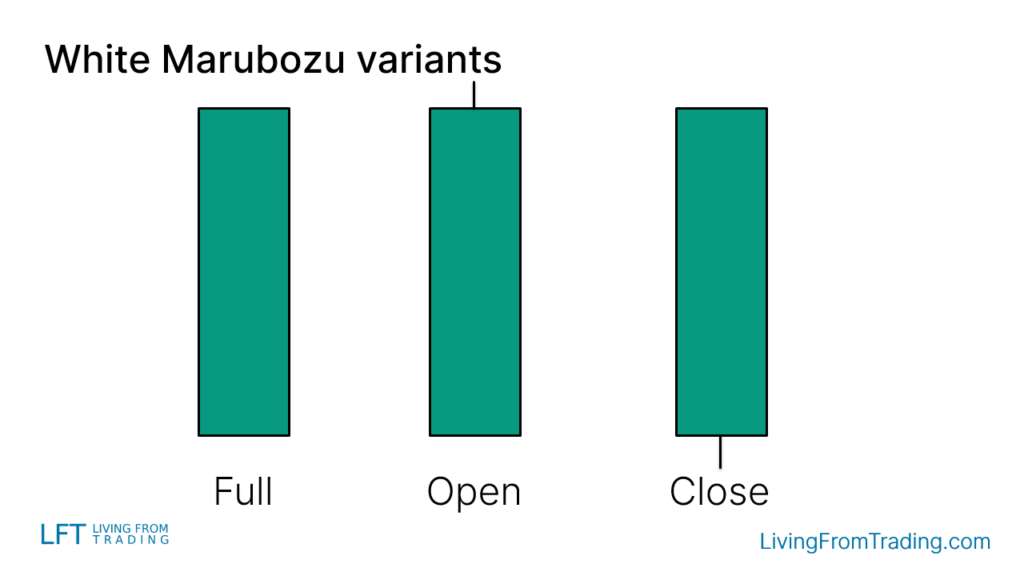
The White Marubozu candlestick pattern may appear in different forms on the chart, with three main variations:
- Full White Marubozu: No upper or lower wicks
- Opening White Marubozu: No lower wick, small upper wick
- Closing White Marubozu: No upper wick, small lower wick
How to Trade?
When trading, relying solely on the pattern is not enough; its location on the chart is crucial. Typically, after a price decline, the appearance of a White Marubozu can signal a possible upward reversal. The usual trading entry point is when the high of the candle is broken. Additionally, setting a stop loss is essential, which can be placed on the opposite side of the pattern to minimize risk.
_56053880_419.png)
Trading Strategies
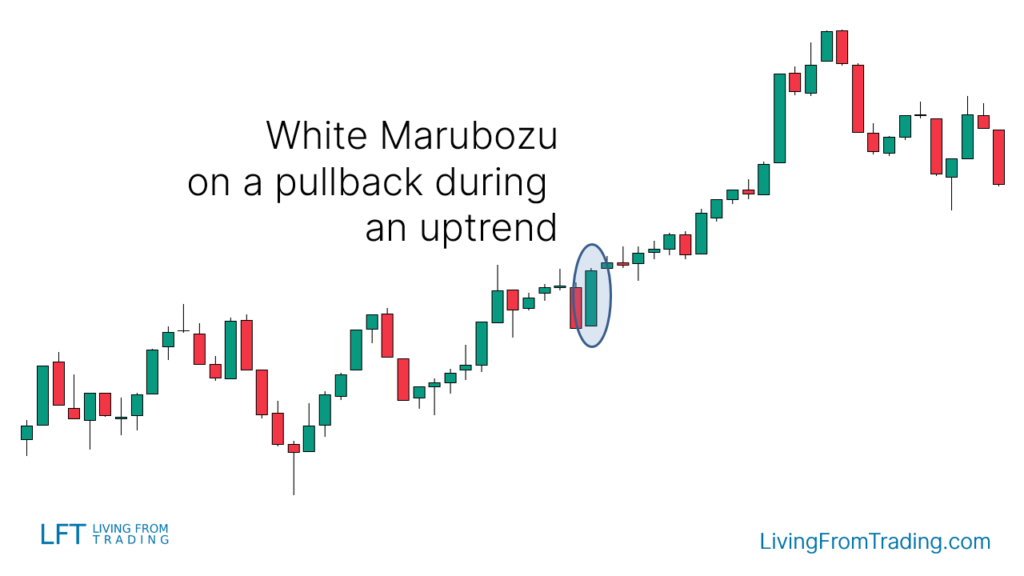
Strategy 1: Naked Chart Pullback
The White Marubozu, as a bullish reversal pattern, is valuable in an uptrend. Wait for a pullback and then enter when the White Marubozu appears, usually signaling the end of the pullback and the start of a new upward move.
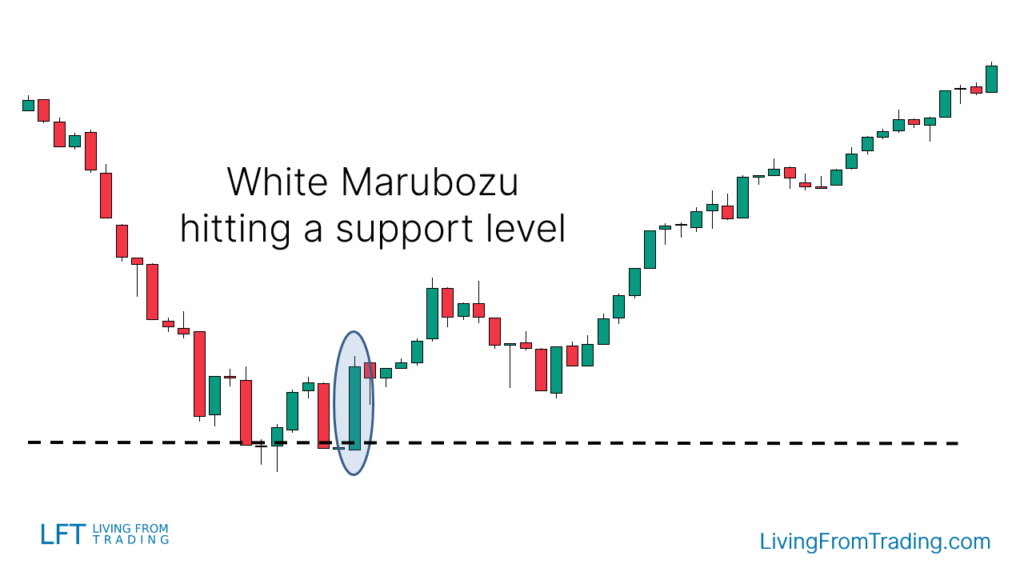
Strategy 2: Trading with Support Levels
Support and resistance levels are ideal places to look for price reversals. The steps to trade a White Marubozu at a support level are:
- Draw the support level on the chart
- Wait for the price to drop and touch the support level
- If a White Marubozu appears at the support level, go long when the candle's high is broken
- Set stop loss and take profit levels, expecting the price to rise
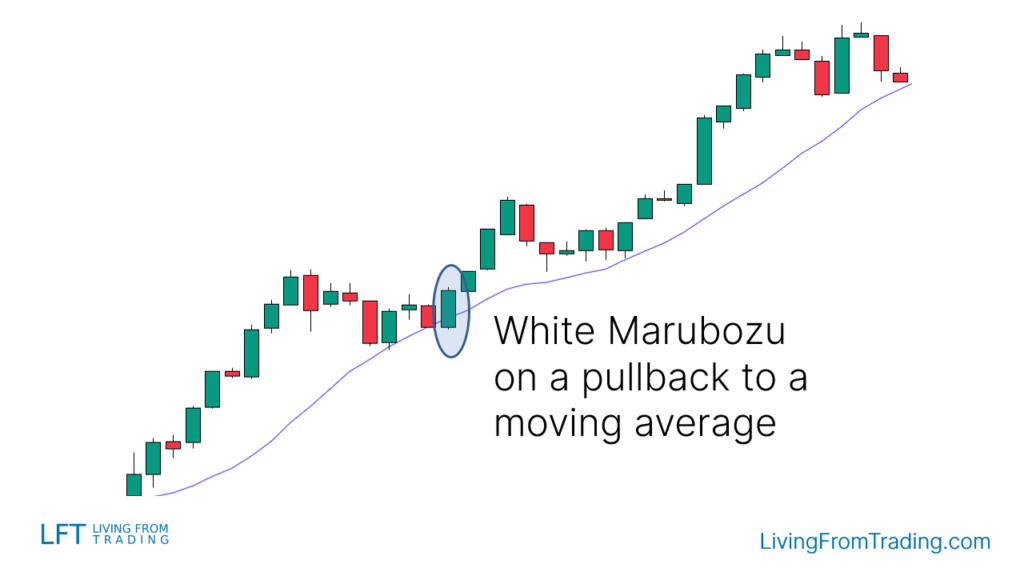
Strategy 3: Trading with Moving Averages
Moving averages are great indicators for trading trends. The strategy is as follows:
- Identify an uptrend with the price above the moving average
- Wait for the price to pull back to the moving average
- If a White Marubozu appears at the moving average, go long when the candle's high is broken
- Set stop loss and take profit levels, expecting further price increase
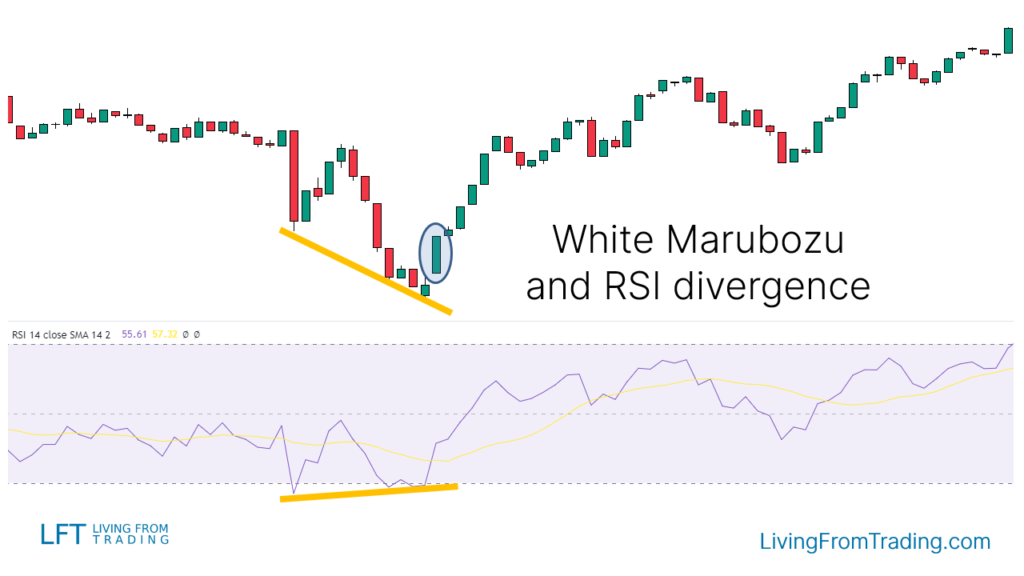
Strategy 4: Trading with RSI Divergence
First, identify a downtrend where the price makes new lows but the RSI indicator does not. A White Marubozu pattern in this context is a signal to enter:
- Identify the downtrend
- Mark each new low in the price
- Compare with the RSI; if the RSI forms higher lows while the price forms lower lows, it indicates divergence
- Wait for a White Marubozu to appear and go long when the candle's high is broken
- Set stop loss and take profit levels, expecting the price to rise
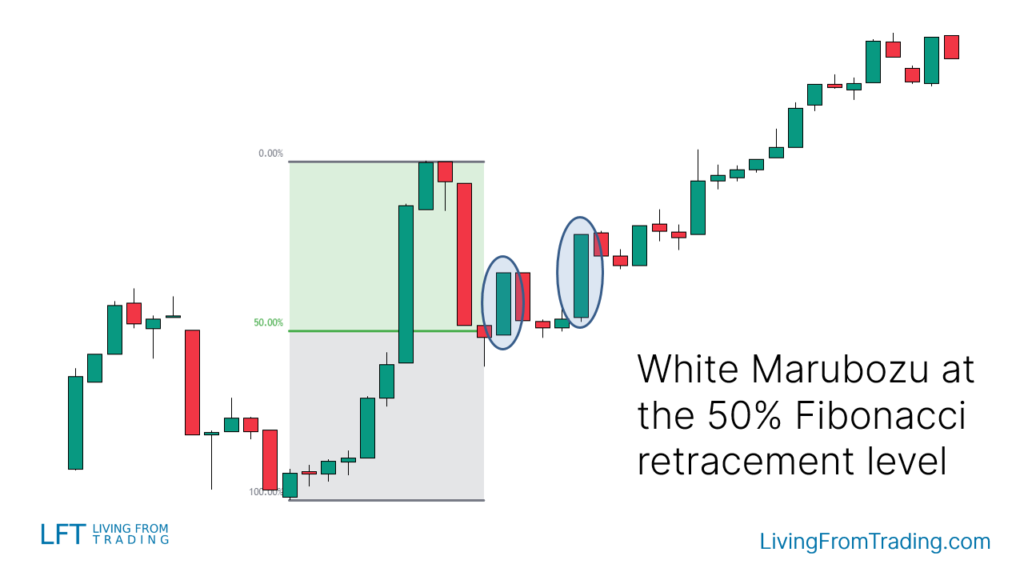
Strategy 5: Trading with Fibonacci Retracement
Using the Fibonacci retracement tool is a popular method to trade the White Marubozu. The steps are:
- Identify an uptrend
- Wait for the price to pull back
- Use the Fibonacci tool to draw retracement levels
- When the price touches a Fibonacci level and a White Marubozu appears, go long when the candle's high is broken
- Set stop loss and take profit levels, expecting the price to rise
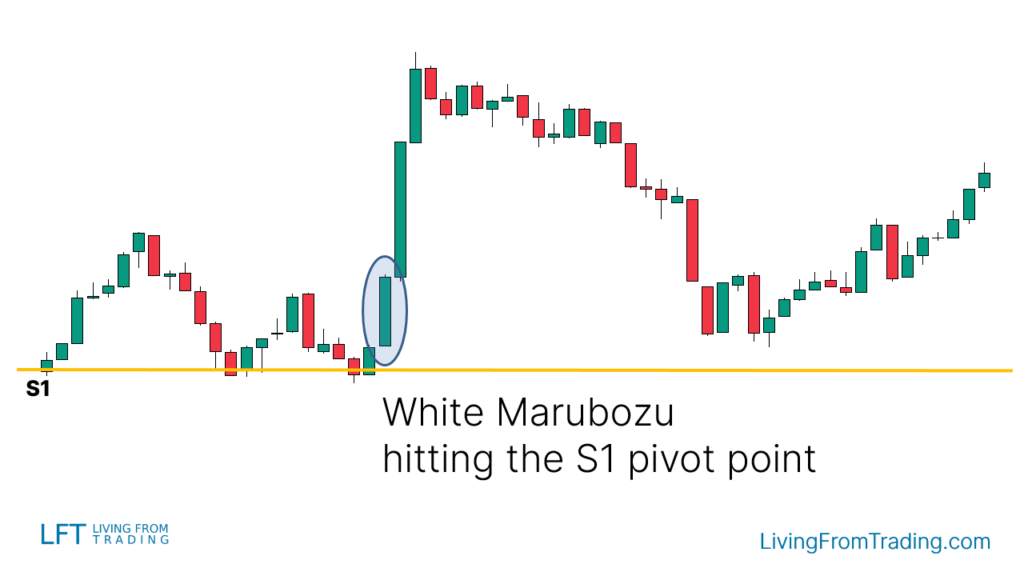
Strategy 6: Trading with Pivot Points
Pivot points are automatically calculated support and resistance levels, suitable for intraday trading. The steps are:
- Activate the pivot point indicator on the chart
- Identify which pivot points are below the price, serving as support
- Wait for the price to pull back to the pivot point level
- When a White Marubozu appears at the pivot point level, go long when the candle's high is broken
- Set stop loss and take profit levels, expecting the price to rise
Conclusion
The White Marubozu is a powerful bullish reversal signal that typically appears after a price decline. Combining it with other technical indicators like pullbacks and moving averages can increase the likelihood of successful trades. Research shows that this pattern has a success rate of 71%, making it a highly reliable pattern for traders.
Disclaimer: The views in this article are from the original Creator and do not represent the views or position of Hawk Insight. The content of the article is for reference, communication and learning only, and does not constitute investment advice. If it involves copyright issues, please contact us for deletion.