Bullish Harami Candlestick Pattern - What Is And How To Trade
Learn all about the Bullish Harami candlestick pattern.What is, how to trade, and all the best trading strategies.

Bullish Harami is a commonly observed bullish reversal pattern with significant importance in technical analysis. This pattern typically appears after a price decline and indicates the market's rejection of lower prices. It suggests a potential opportunity for a market reversal and is widely used to forecast future price movements.
Definition of Bullish Harami Candlestick Pattern
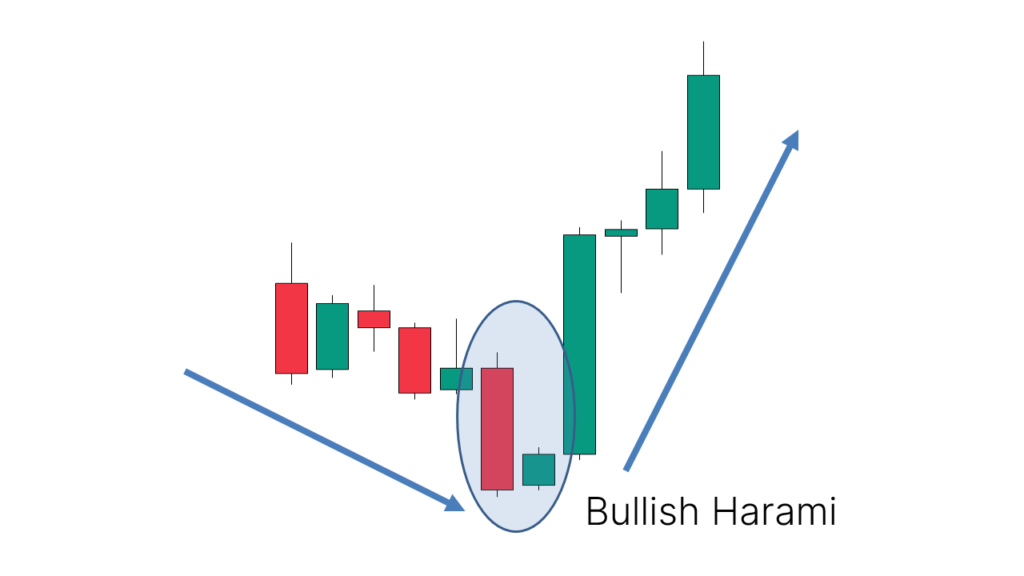
A Bullish Harami is a Japanese candlestick pattern composed of two candlesticks with the following characteristics:
- First Candlestick: It must be bearish, meaning it has a large body and shows a decline throughout the day. This candlestick indicates that the market experienced significant selling pressure on the previous trading day.
- Second Candlestick: It must be bullish, meaning it has a smaller body and is entirely contained within the body of the first candlestick. This candlestick shows that the market's acceptance of lower prices is diminishing and buying pressure may be starting to emerge.
This pattern signals a potential rebound after a downtrend, indicating a bullish signal.
How to Identify Bullish Harami
To identify the Bullish Harami pattern, consider the following:
- First Candlestick: It should be a long bearish candlestick, reflecting significant selling pressure.
- Second Candlestick: It should be a short bullish candlestick whose open and close are entirely within the body of the first candlestick.
- Pattern Location: The pattern usually appears at the end of a downtrend, indicating a potential reversal point.
On the chart, a Bullish Harami typically appears as a large bearish candlestick followed by a smaller bullish candlestick, completely within the body of the previous candlestick.
_2568368676_632.png)
Variations of Bullish Harami
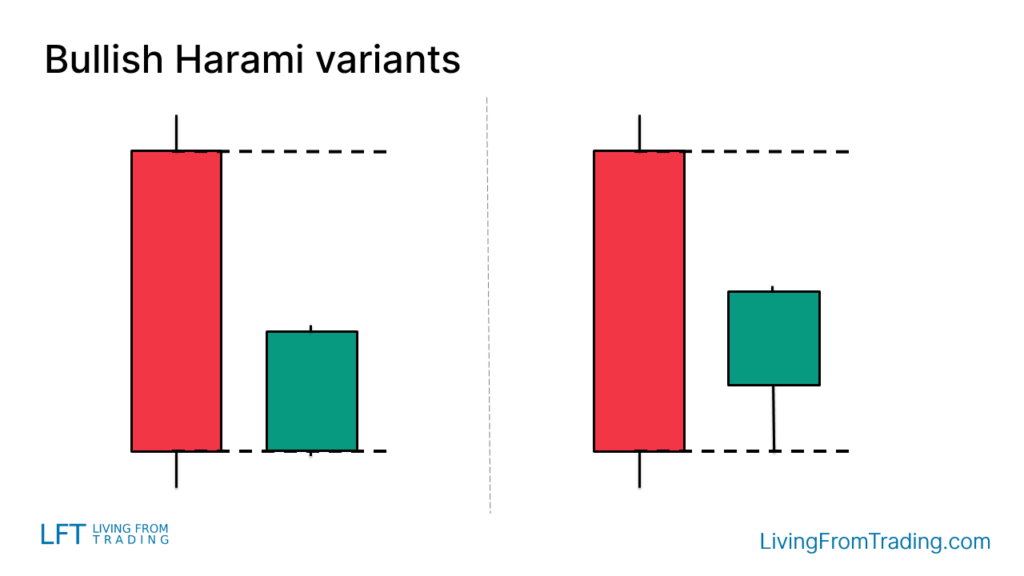
The Bullish Harami may have some variations, including:
- No Gap Between Candles: The second candlestick may have no noticeable gap from the first candlestick.
- Long Shadows: The second candlestick may have a long lower shadow, indicating stronger buying pressure.
These variations do not affect the pattern's effectiveness as a bullish reversal signal but should be considered during analysis.
How to Trade
When trading, it is important to consider the pattern's location and the overall market conditions. Here are some common trading strategies:
-
Identifying the Pattern: After a downtrend, the appearance of a Bullish Harami is a potential reversal signal. Traders should observe if the pattern formation meets expectations and if it appears at a key support level or technical indicator.
-
Entry Timing: Traders can enter a long position when the price breaks above the high of the second candlestick in the Bullish Harami pattern. This breakout signal often indicates that the price may continue to rise.
-
Stop-Loss Setting: A common stop-loss method is to place it on the opposite side of the pattern, below the low of the pattern. This helps limit losses if the market does not move as expected.
Trading Strategies
Here are some effective trading strategies for theBullish Harami:
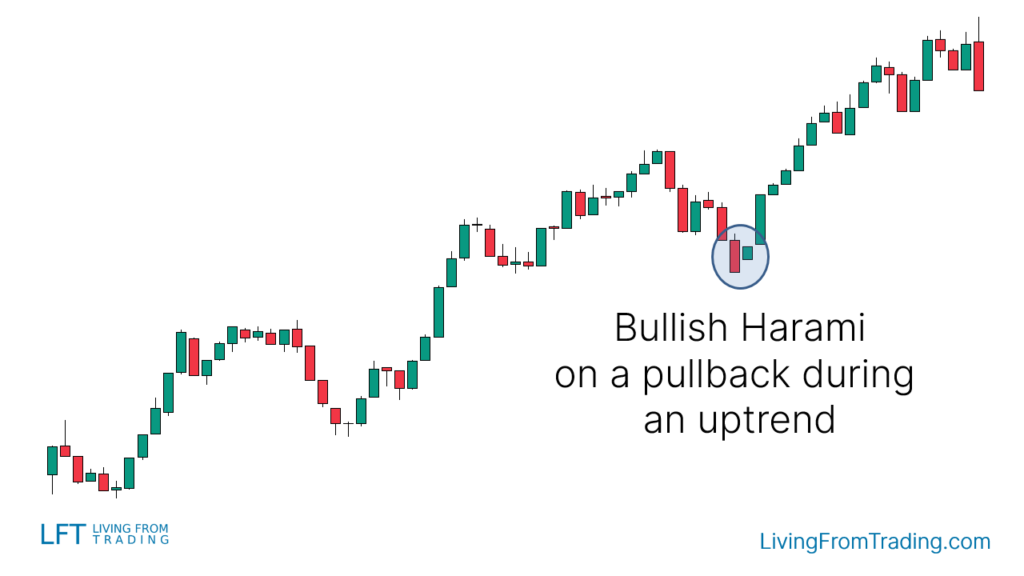
Strategy 1: Naked Chart Retracement
- Strategy Description: In an uptrend, wait for a price retracement followed by the formation of a Bullish Harami pattern, which usually signals the end of the retracement and the beginning of a new phase of upward movement.
- Steps: Monitor if the price retraces to a support level and buy when the Bullish Harami pattern appears.
Strategy 2: Support Level Trading
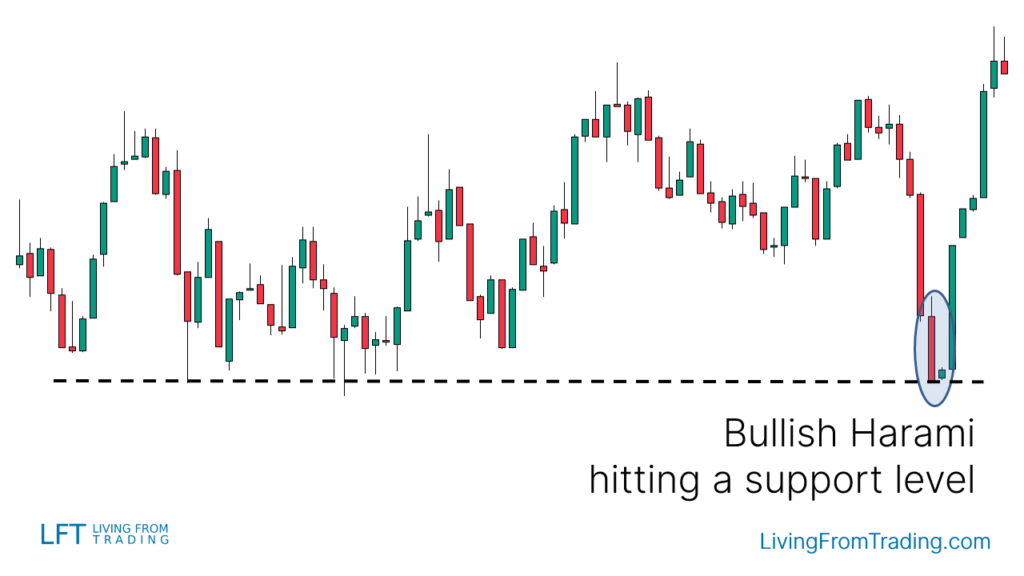
- Strategy Description: Support levels are key areas for identifying price reversals. When a Bullish Harami appears at a support level, it often indicates that the price is likely to bounce back upward.
- Steps: Draw support levels on the chart, wait for the price to drop to the support level and form a Bullish Harami, then go long when the price breaks above the high of the pattern.
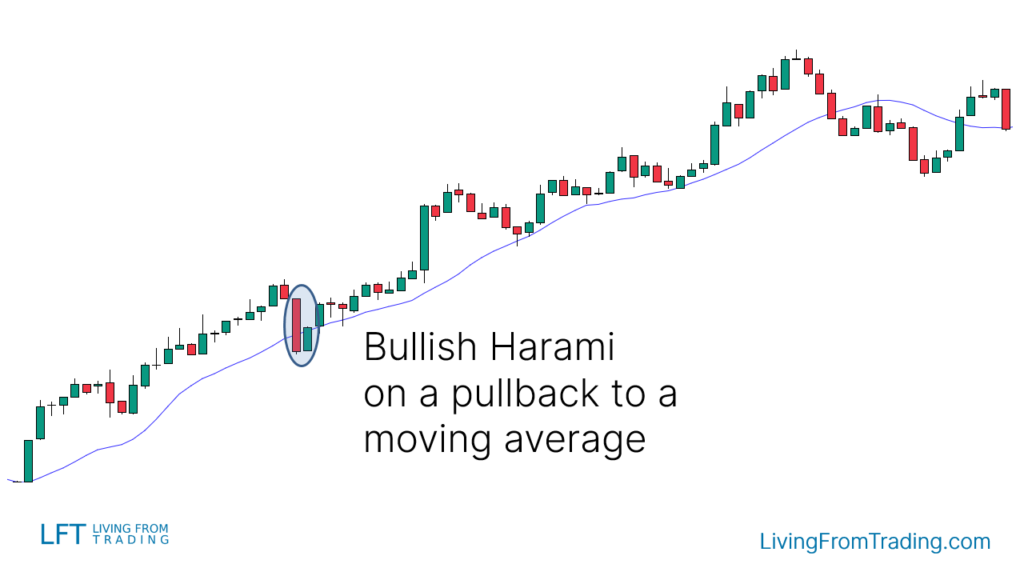
Strategy 3: Moving Average Trading
- Strategy Description: In an uptrend, if the price retraces to near a moving average and forms a Bullish Harami, it is a strong buy signal.
- Steps: Look for a Bullish Harami formation near a moving average and enter a long position when the price breaks above the high of the pattern.
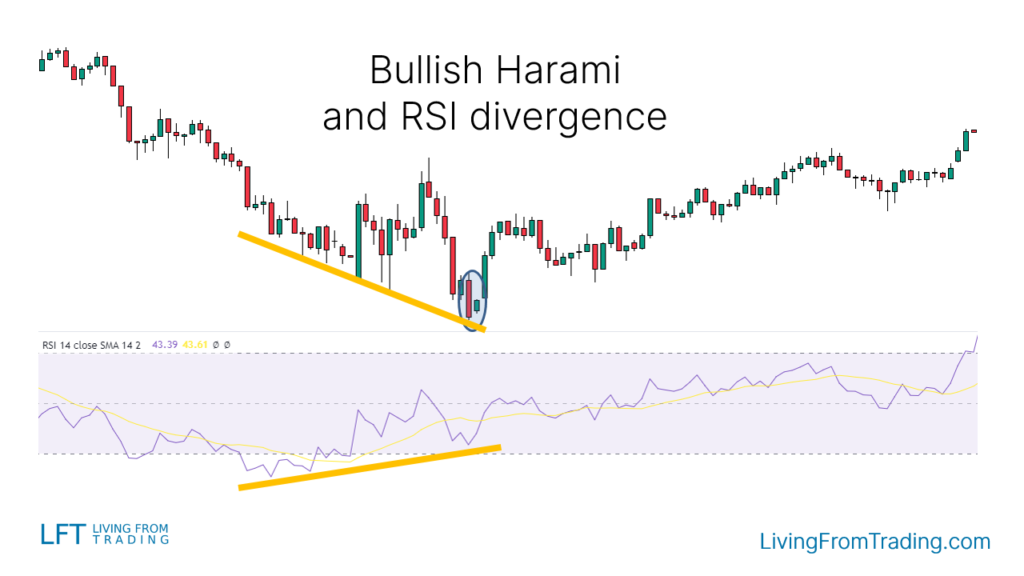
Strategy 4: RSI Divergence Trading
- Strategy Description: When the price makes a new low while the RSI indicator forms a new high, it suggests a potential market reversal.
- Steps: Identify RSI divergence signals and go long when a Bullish Harami forms at a price low.
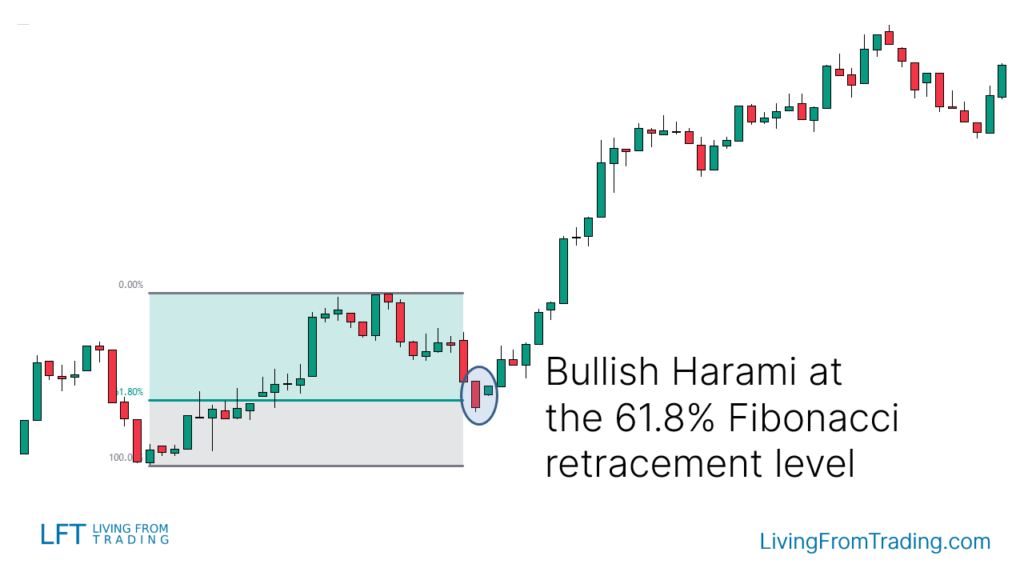
Strategy 5: Fibonacci Retracement Trading
- Strategy Description: Fibonacci retracement levels can help identify price reversal points. When a Bullish Harami appears at a Fibonacci retracement level, it is a buy signal.
- Steps: Use Fibonacci tools to draw retracement levels and enter a long position when the price touches these levels and forms a Bullish Harami.
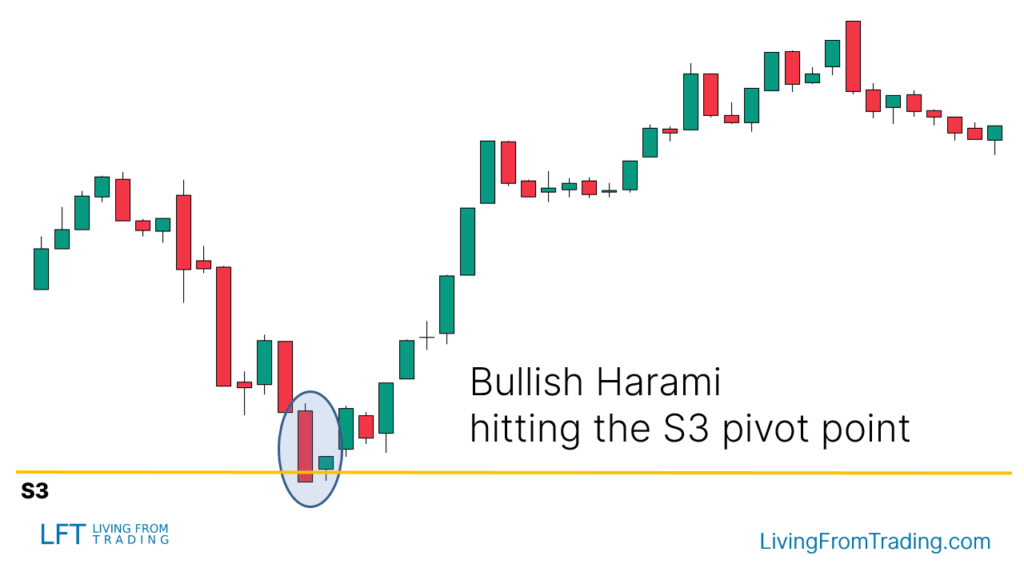
Strategy 6: Pivot Points Trading
- Strategy Description: Pivot Points provide automatically calculated support and resistance levels suitable for intraday trading.
- Steps: Apply Pivot Points indicators to the chart, observe if the price retraces to the Pivot Point level and forms a Bullish Harami, then go long when the price breaks above the high of the pattern.
Summary
The Bullish Harami is an effective bullish reversal pattern, especially when it appears after a price decline, typically signaling a potential market rebound. Combining this pattern with moving averages, RSI, Fibonacci retracements, and other technical analysis tools can further enhance trading accuracy and success rates.
Disclaimer: The views in this article are from the original Creator and do not represent the views or position of Hawk Insight. The content of the article is for reference, communication and learning only, and does not constitute investment advice. If it involves copyright issues, please contact us for deletion.