Comprehensive Analysis of Bearish and Bullish Markets
Difference between bullish and bearish markets.How to trade them.Which indicators to use.Where to invest during recessions and bull markets.

Understanding the basics of bearish and bullish markets is crucial for successful trading. This article delves into the characteristics of bull and bear markets, how to identify market tops, trading strategies, and more, helping investors make informed trading decisions.
What is a Bull Market?
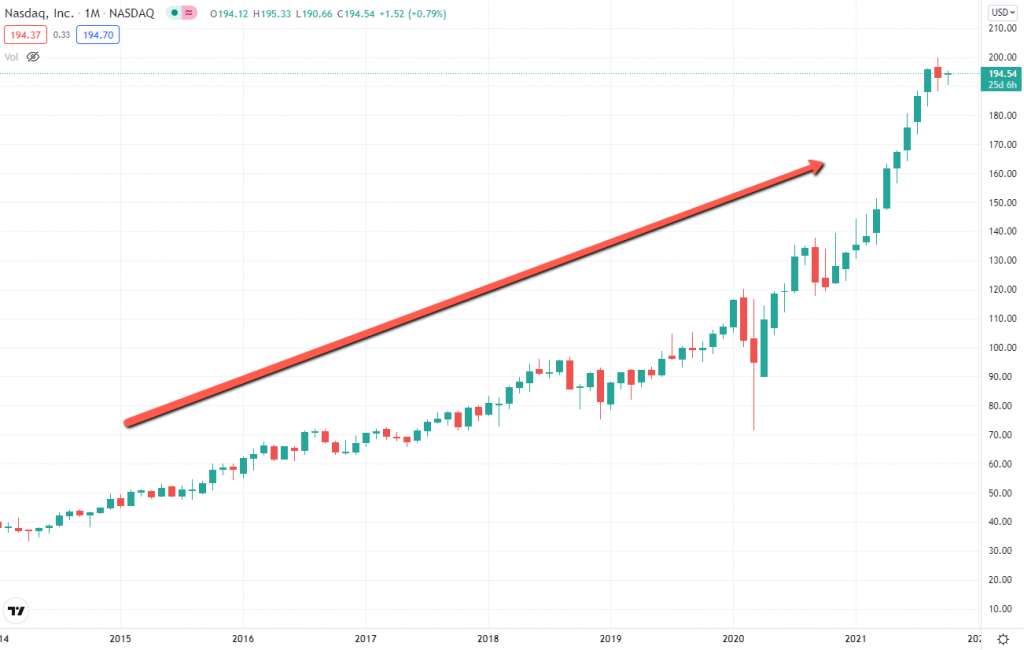
A bull market is characterized by a general upward trend in market prices. In a bull market, prices tend to increase over time, although this rise is not a straight line but involves oscillations.
The key feature is that each upward move is usually larger than each downward move, leading to a gradual increase in market prices. The formation of a bull market typically involves the following stages:
- Market Begins to Rise: Investors start building positions as prices rise.
- Profit-Taking: At some point, investors begin to sell off to lock in profits, causing the market to pull back.
- Change in Market Sentiment: Due to changes in economic fundamentals or market sentiment, more investors may start selling, leading to a deeper price decline and forming a market top.
What is a Bear Market?
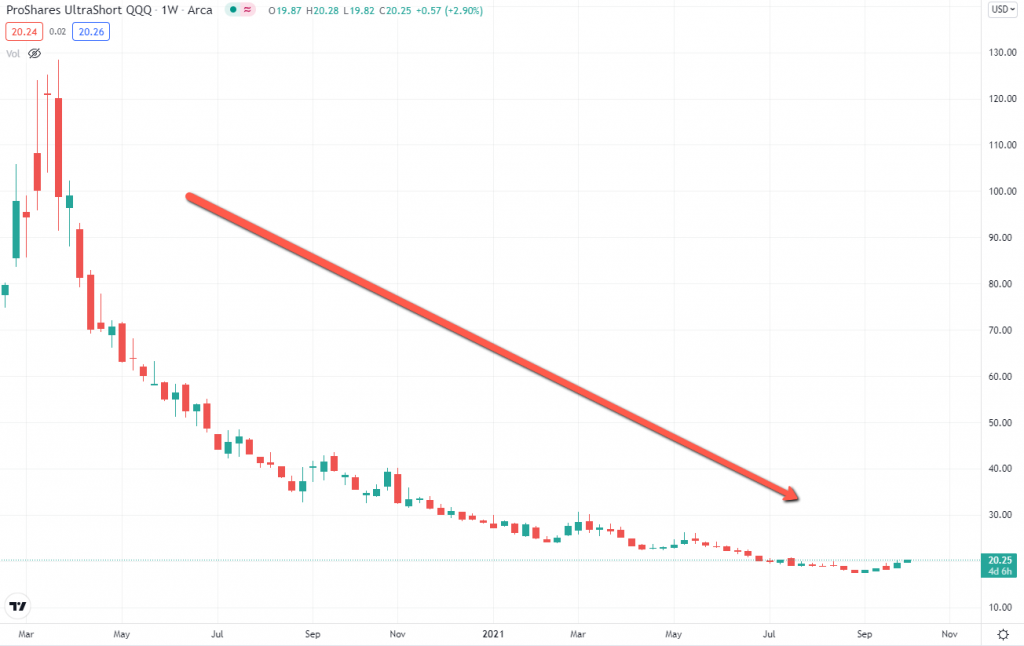
A bear market is the opposite of a bull market, characterized by a general downward trend in prices. In a bear market, each downward move is usually larger than each upward move, resulting in a prolonged decline. Key features of a bear market include:
- Market Continues to Decline: Prices consistently fall, with smaller rebounds.
- Increased Selling Pressure: Investors, pessimistic about future prospects, sell off their holdings, causing prices to drop further.
- Market Panic: Increased selling accelerates price declines, forming a market bottom.
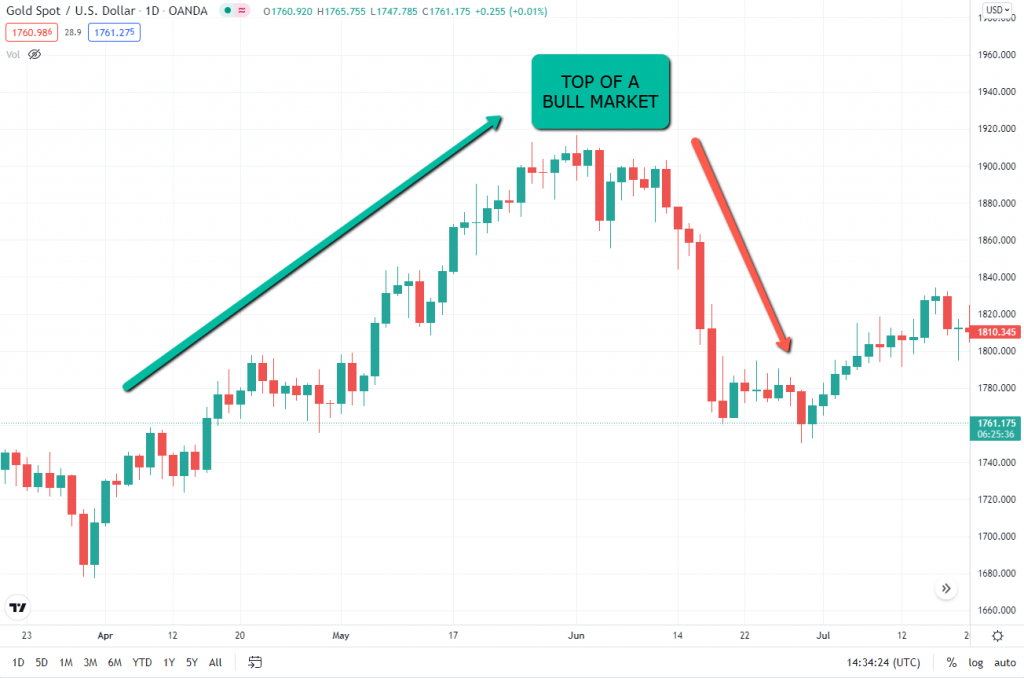
How are Market Tops Formed?
Market tops often appear when prices begin to reverse direction. This can happen due to:
- Profit-Taking: Investors start selling when the market reaches a high point to lock in gains.
- Economic Fundamental Changes: Changes in economic conditions or fundamentals may make investors skeptical about the continuation of the uptrend.
- Market Sentiment Shift: Investors may become cautious, leading to increased selling and a more rapid decline in prices, often resulting in a market crash.
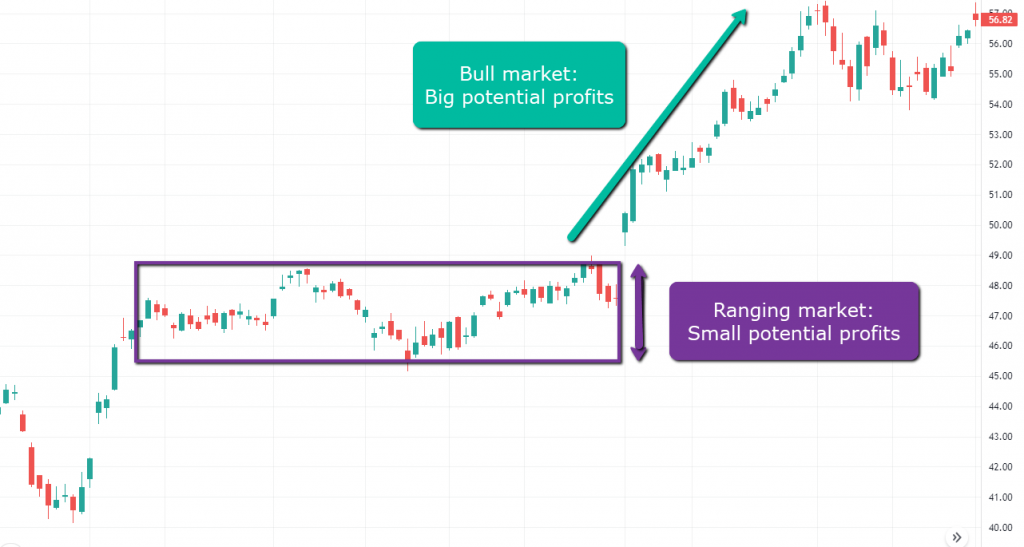
Why Trade Trending Markets?
Trending markets, whether up or down, can deliver the highest profits because they are moving, unlike ranging markets that move sideways. In trending markets, you can let positions run longer compared to range-bound markets with limited movement.
How to Trade with Trendlines?
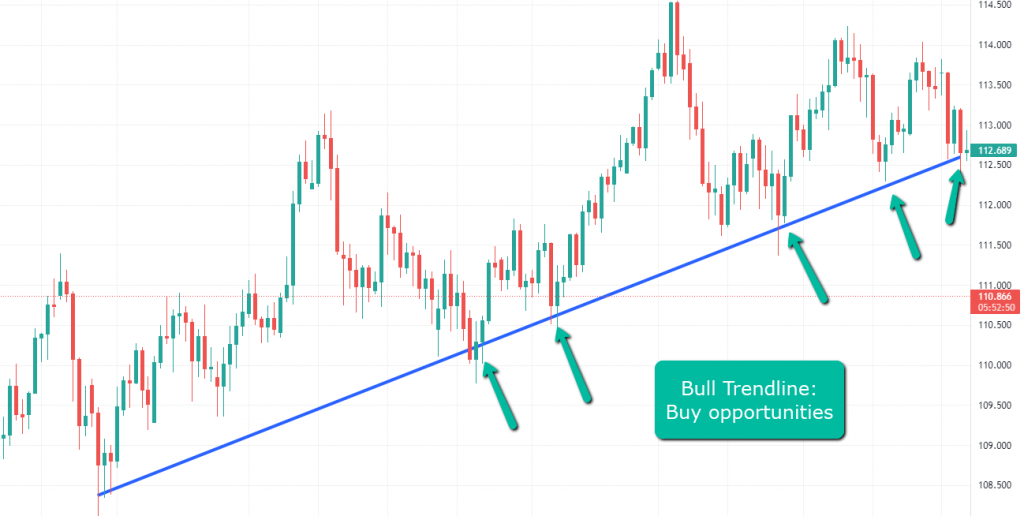
- Bull Market Trendline Trading: In a bull market, draw a trendline by connecting two consecutive lows and extending it to the right. A touch and rejection from this trendline is a potential buy opportunity.
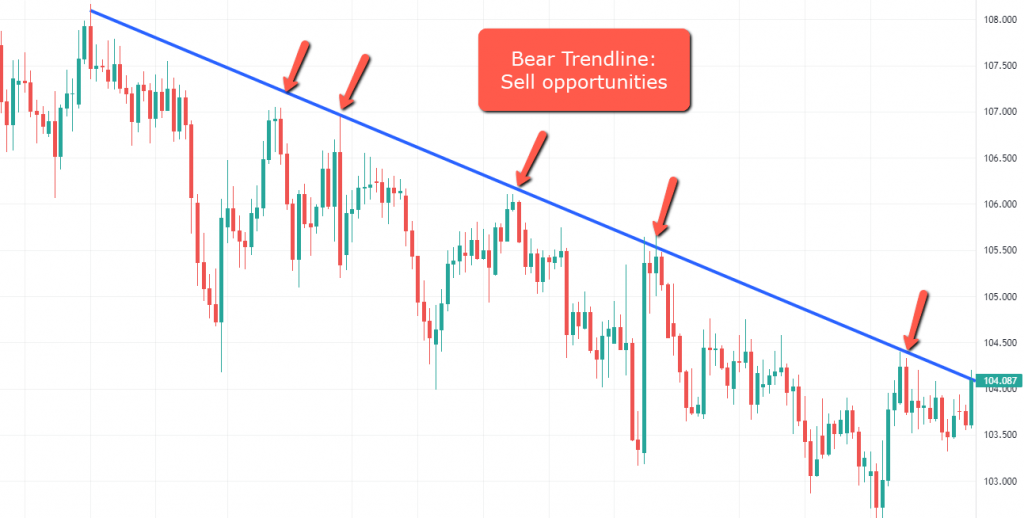
- Bear Market Trendline Trading: In a bear market, draw a trendline by connecting two consecutive highs and extending it to the right. A touch and rejection from this trendline is a potential short opportunity.
How to Trade with Channels?
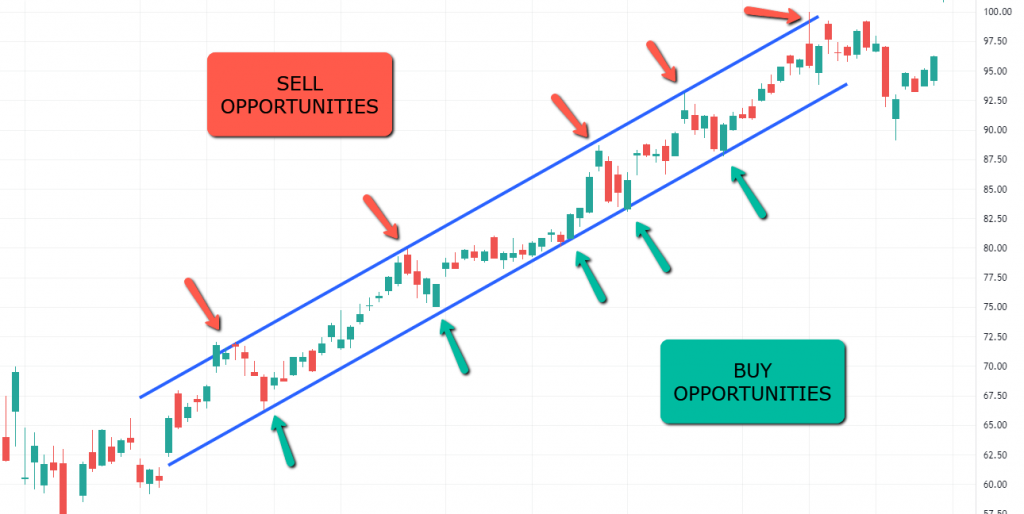
- Bull Market Channel Trading: In a bull market, draw a channel with two parallel trendlines. Use the first two consecutive lows to draw the lower trendline and extend it upwards. When the price bounces off the lower boundary, it’s a buying opportunity, and when it reaches the upper boundary, consider closing your trade or shorting.
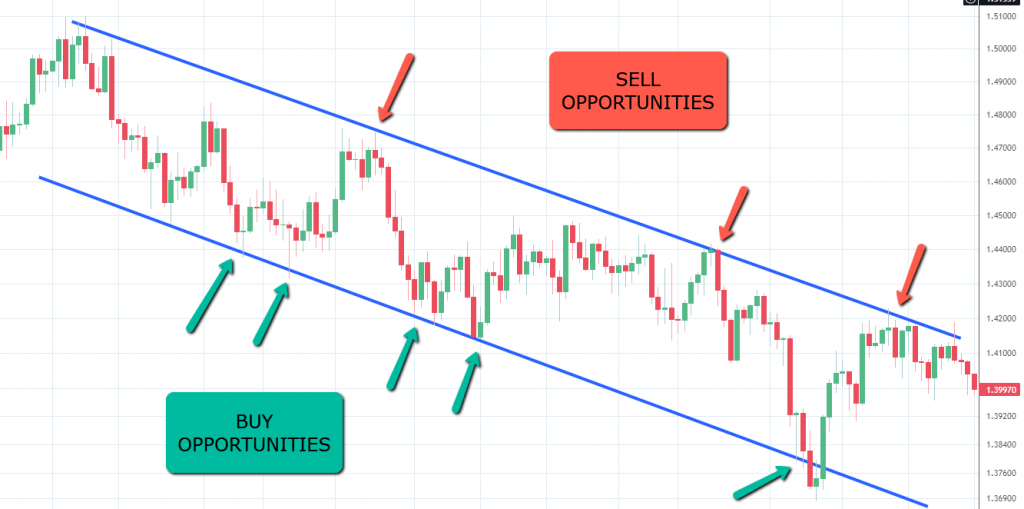
- Bear Market Channel Trading: In a bear market, draw a bearish trendline with two consecutive highs and create a parallel trendline to match the previous lows. A touch at the top of the channel can be a short opportunity, while a touch at the lower trendline may be a long opportunity.
How to Trade with Moving Averages?
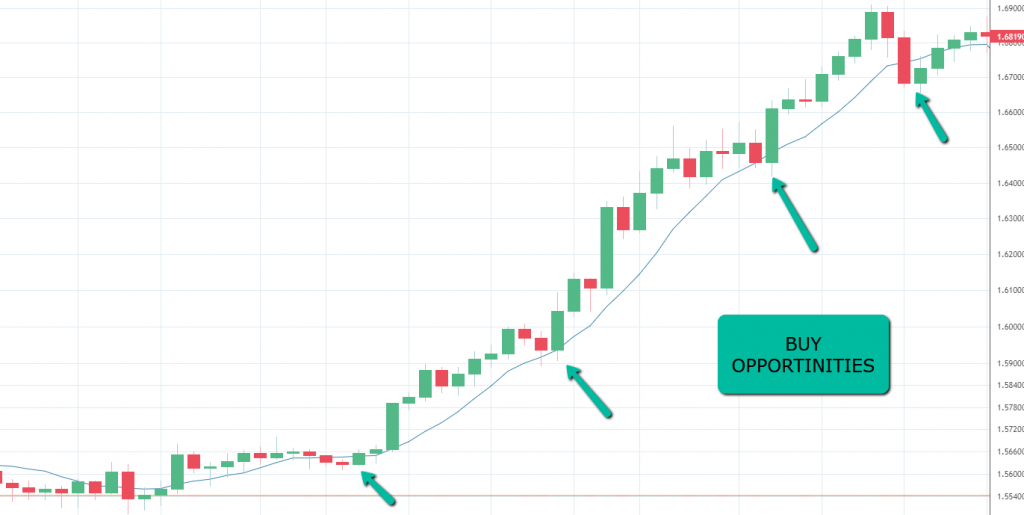
- Bull Market Moving Average Trading: Use different period moving averages (e.g., 8-day, 20-day, 50-day, 200-day). Choose one that fits the market trend and look for buying opportunities when the price touches and rebounds from the moving average.
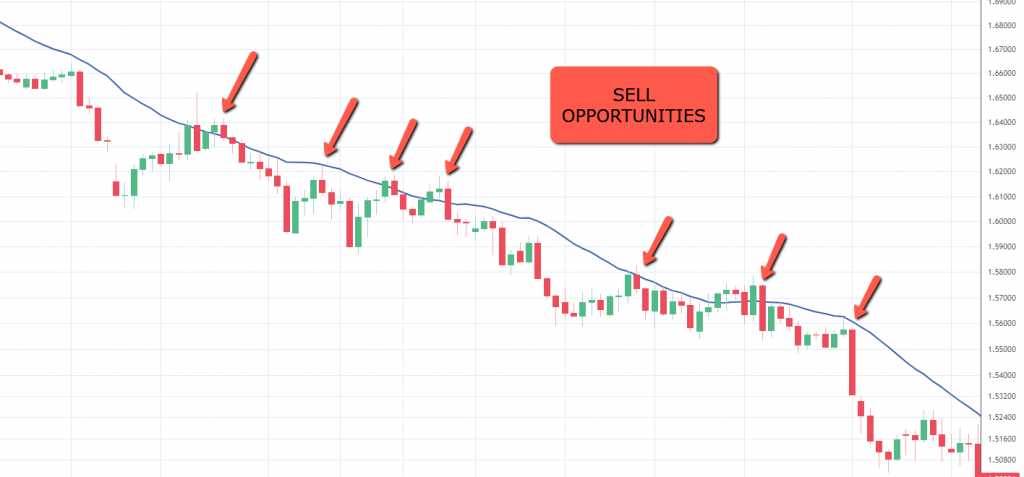
- Bear Market Moving Average Trading: Similarly, use moving averages in a bear market. Choose a moving average that fits the downtrend, and look for short opportunities when the price touches and rebounds from the moving average.
How to Trade with Fibonacci?
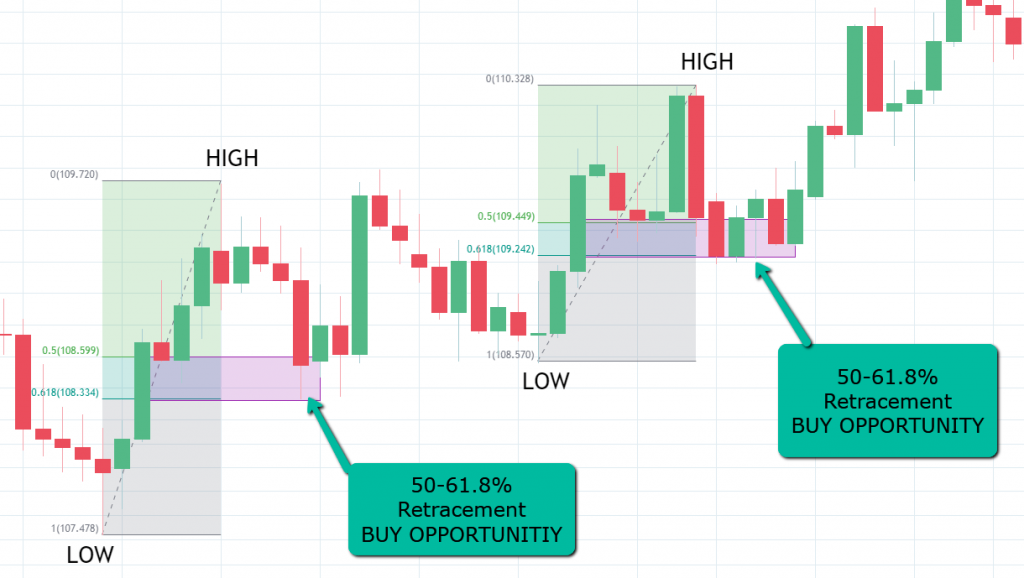
- Bull Market Fibonacci Trading: In an uptrend, use the Fibonacci tool from a low to a high. Look for price retracement to the 50%-61.8% levels, where price tends to be rejected, presenting a buying opportunity.
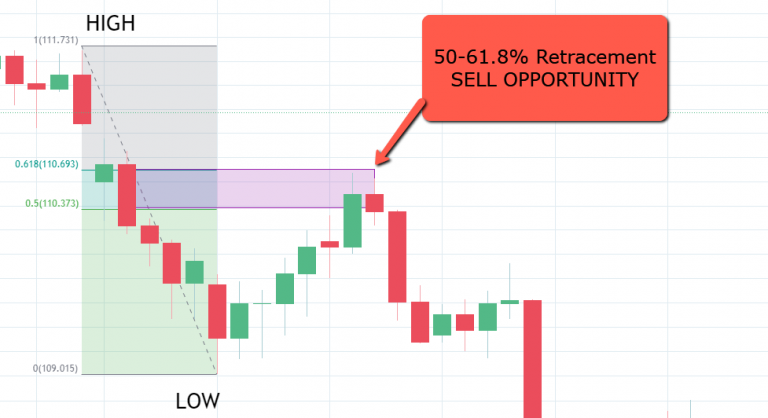
- Bear Market Fibonacci Trading: In a downtrend, use Fibonacci from a high to a low. Look for price retracement to the 50%-61.8% levels, where price tends to be rejected, presenting a short opportunity.
Oversold vs Overbought
Oversold and Overbought Definitions: Oversold and overbought conditions are measured using the Relative Strength Index (RSI), which ranges from 0 to 100. RSI values above 70 indicate an overbought market, while values below 30 indicate an oversold market.
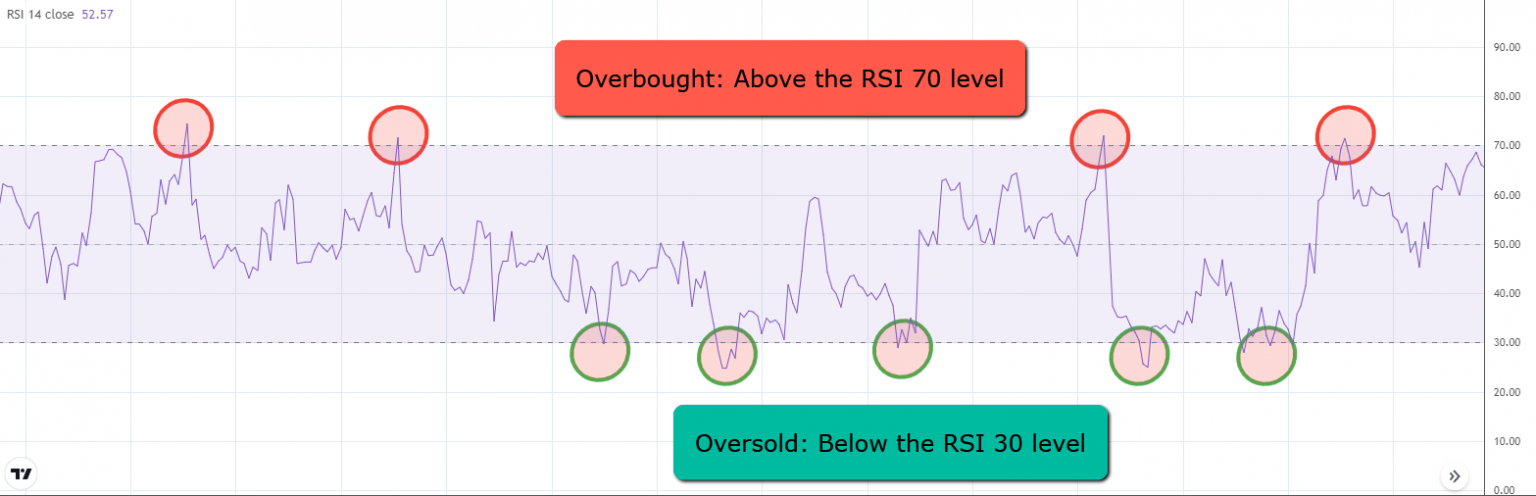
Is Oversold Bullish or Bearish?
An oversold market indicates a potential bullish trend starting, as RSI values below 30 suggest the possibility of a price rebound.
Is Overbought Bullish or Bearish?
An overbought market indicates a potential bearish trend starting, as RSI values above 70 suggest the possibility of a price drop.
Different Time Frames in Market Trends
Markets can display different trends across various time frames. Higher time frames (e.g., daily charts) often show stronger trends. For instance, if a market is trending down on a daily chart, the optimal trading direction might be to short the market. However, even in a downtrend, there may be pullbacks—short-term price increases during a downtrend, after which the price returns to the original trend.
On a lower time frame (e.g., 15-minute charts), a pullback can create a temporary uptrend. Thus, while the daily chart shows a downtrend, the 15-minute chart might show an uptrend, allowing investors to go long temporarily while maintaining a short position on the daily chart.
Popular Trend Indicators
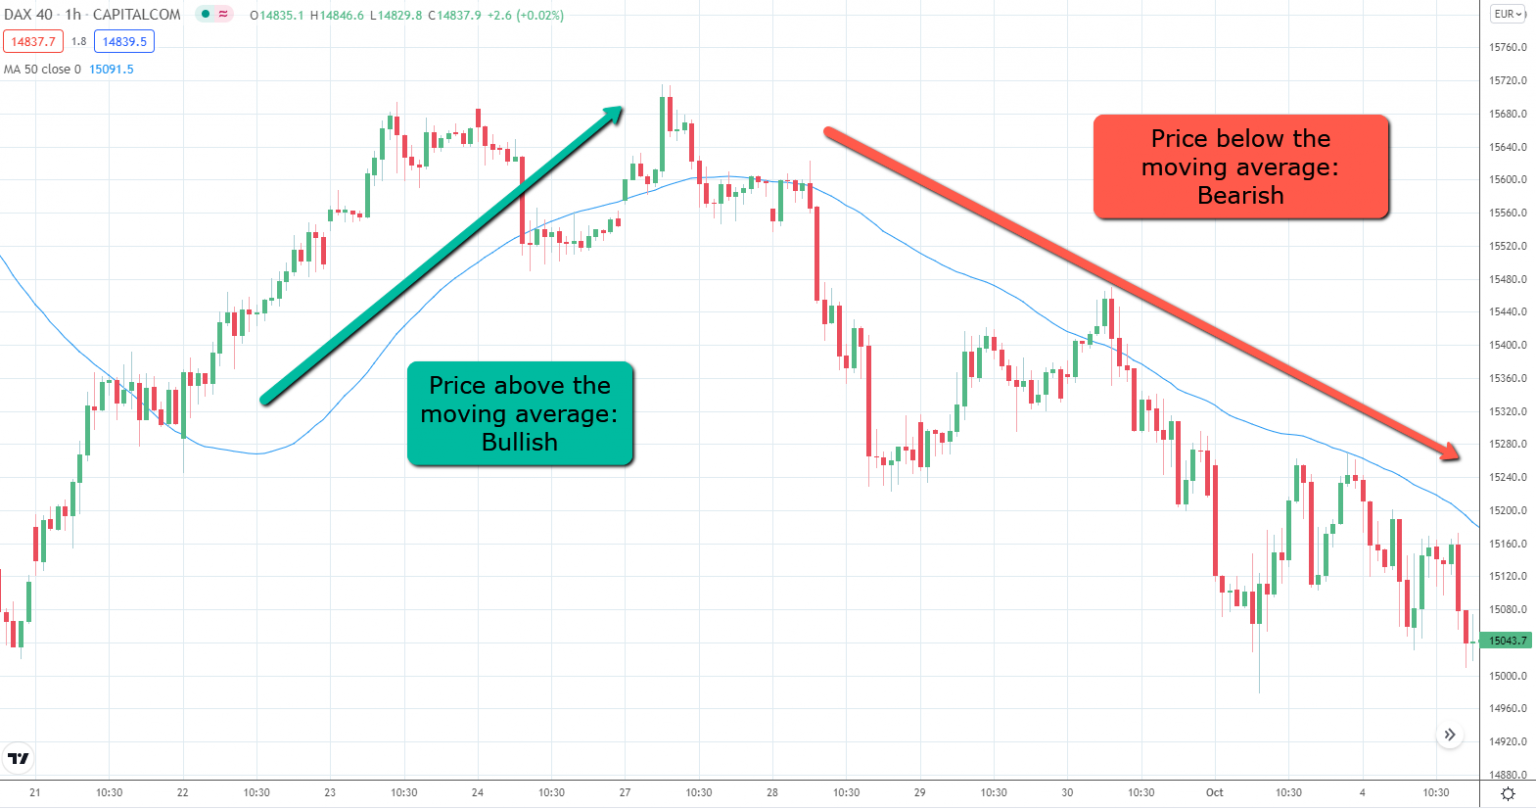
Moving Averages
Moving averages are one of the most common trend indicators. When the price is above the moving average, it indicates a bullish trend; when the price is below, it indicates a bearish trend.
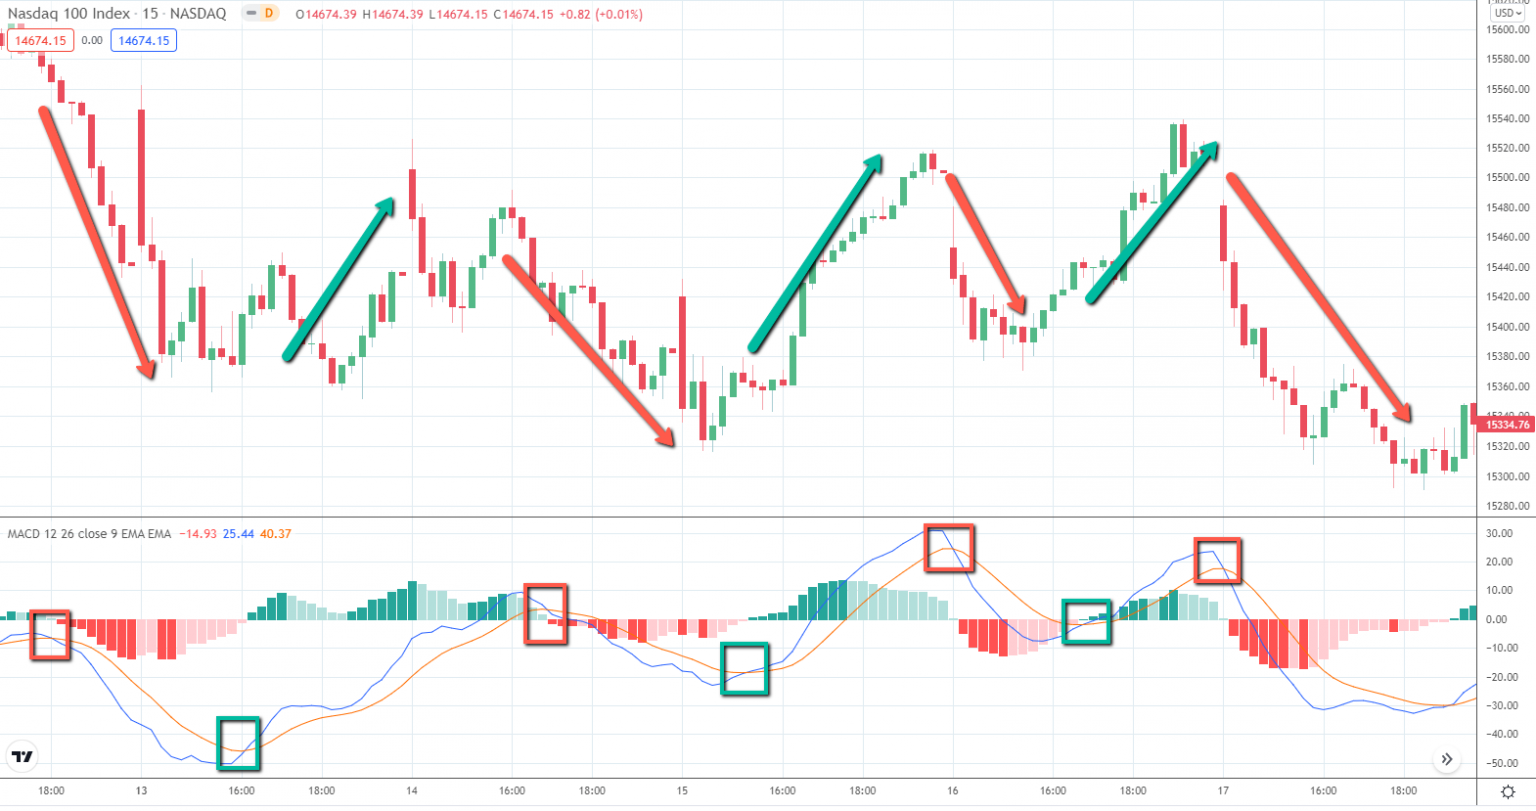
MACD
The MACD is another popular trend indicator. It involves the cross between the MACD line and the Signal line. When the MACD line (blue) crosses below the Signal line (yellow), it signals a potential bearish move; when it crosses above, it indicates a potential bullish move.
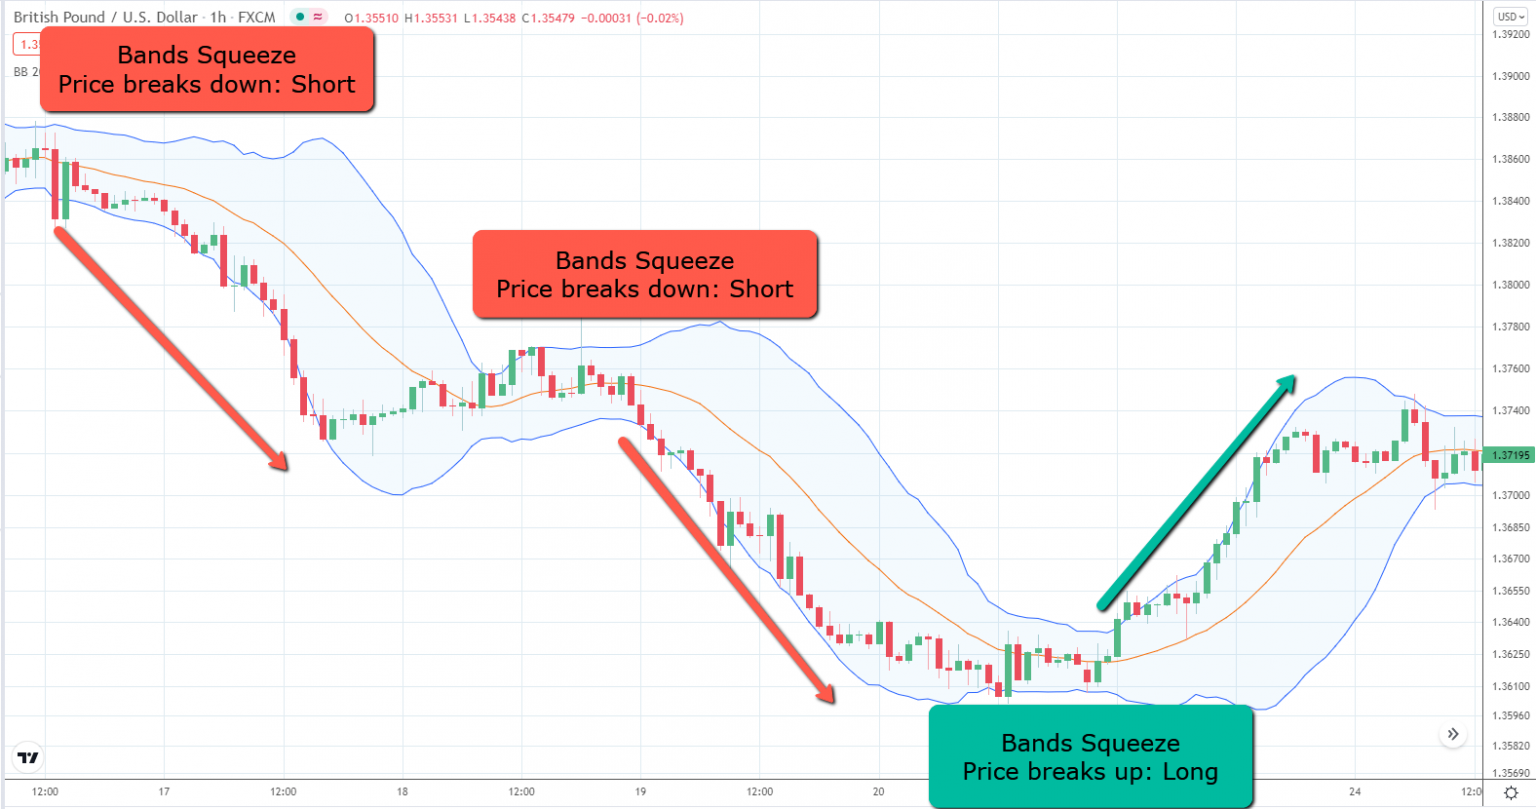
Bollinger Bands
Bollinger Bands consist of two bands that squeeze and expand. When the bands squeeze, the price is moving sideways. A break below the squeeze zone indicates a bearish signal, while a break above signals a bullish trend. During a bullish or bearish trend, the bands typically expand.
Detecting Trend Changes
Changing from Bullish to Bearish
- Using Moving Averages: Wait for the price to cross from above to below the moving average.
- Using MACD: Wait for the MACD line to cross below the Signal line.
- Using Bollinger Bands: Wait for the bands to squeeze and the price to break downward.
- Using Candle Strength: Look for large candles in the opposite direction of the trend. Bearish engulfing patterns at market highs can be indicative.
- Using Chart Patterns: The head and shoulders pattern is commonly used to identify a bearish trend.
Changing from Bearish to Bullish
- Using Moving Averages: Wait for the price to cross from below to above the moving average.
- Using MACD: Wait for the MACD line to cross above the Signal line.
- Using Bollinger Bands: Wait for the bands to squeeze and the price to break upward.
- Using Candle Strength: Look for large candles showing strength to the upside. Bullish engulfing patterns at market lows can be indicative.
- Using Chart Patterns: The inverted head and shoulders pattern is commonly used to identify a bullish trend.
Trend Traps
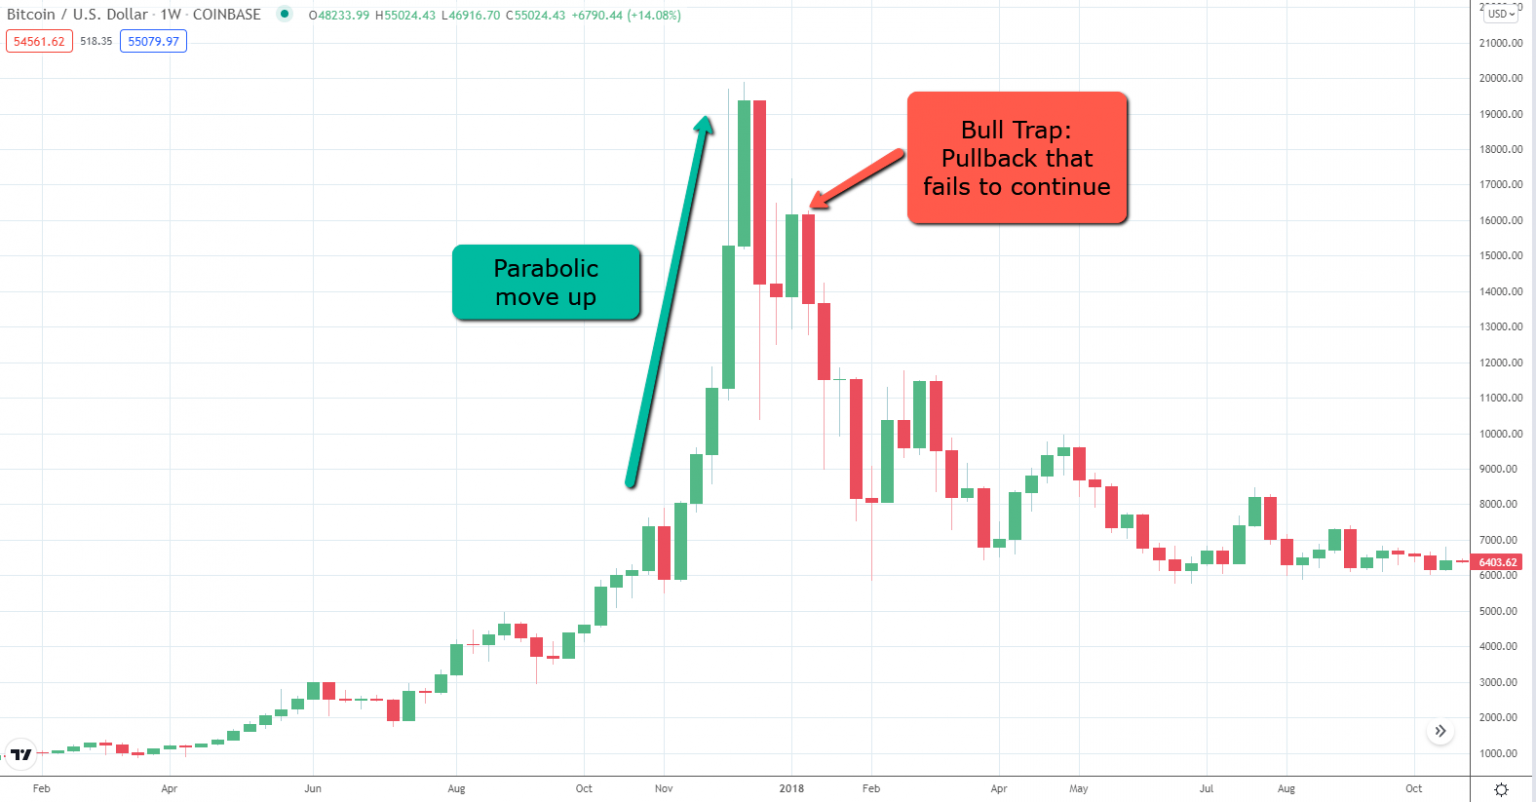
Bull Trap
A bull trap often appears after a significant uptrend. The price may rise parabolically and then suddenly collapse, trapping investors who entered the market late. This pattern is typically seen as a sharp price drop after a rapid increase.
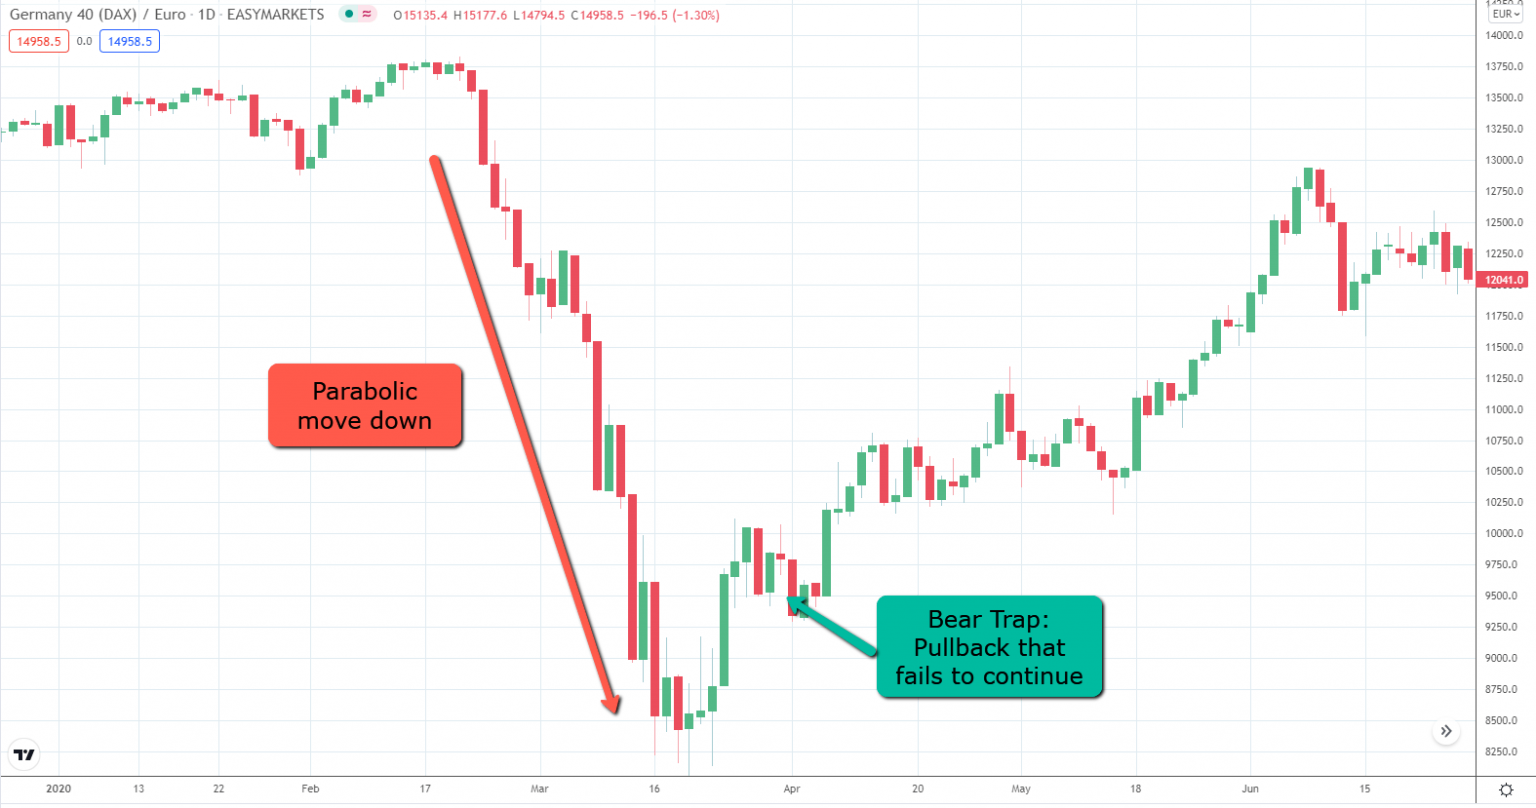
Bear Trap
A bear trap occurs in the opposite direction, usually after a downtrend. During market crashes, many investors may sell off their positions, leading to further declines. However, the market eventually rebounds, trapping those who shorted the market after the drop.
Investment Strategies in Bull and Bear Markets
Investing During a Bull Market
During a bull market, consumers have more spending power. The following sectors and companies typically perform well:
- Technology Stocks: Companies like Apple Inc. (AAPL) usually perform well in a bull market.
- Travel Companies: Examples include Booking Holdings (BKNG), Southwest Airlines (LUV), and Marriott Hotels (MAR).
- Real Estate and Construction: Companies such as Simon Property Group (SPG) benefit from increased buying activity.
- Automobile Manufacturers: Companies like Tesla Inc. (TSLA) thrive in a bull market due to recovery and green vehicle trends.
Investing During a Recession
Recessions generally lead to bear markets, but not all sectors are negatively impacted. For instance, during the 2008 recession, several S&P 500 companies still posted gains. Key sectors that often perform well include:
- Food and Restaurant Industry: Fast-food chains like McDonald’s (MCD) and packaged food companies typically see increased demand during recessions.
- Health Industry: Companies such as Amgen Inc. (AMGN) benefit from continued demand for medical services and products.
- Auto Parts and Accessories Retailers: Companies like AutoZone (AZO) see increased sales as consumers opt to repair rather than replace vehicles.
- DIY and Home Repairs: Consumers may engage in home repairs to cut costs, benefiting companies in the DIY sector.
Disclaimer: The views in this article are from the original Creator and do not represent the views or position of Hawk Insight. The content of the article is for reference, communication and learning only, and does not constitute investment advice. If it involves copyright issues, please contact us for deletion.