What Are Pivot Points? Definition and Trading Strategy Analysis
Learn how to use pivot points to draw automatic support and resistances levels and trading strategies for intraday and swing trading.

In financial trading, pivot points are a common and effective technical analysis tool widely used to identify key support and resistance levels.
For novice traders, learning to draw support and resistance lines is the first step. However, this often requires in-depth analysis of charts to find price highs and lows, a process that can be subjective. Pivot points, on the other hand, automatically generate support and resistance levels, eliminating the complexity of manual analysis and providing a more objective method of market analysis.
What are Pivot Points?
Pivot points are indicators used to identify key areas on a chart. They serve as the foundation of the entire analysis, and from this pivot point, multiple support and resistance lines can be drawn. Typically, when prices approach these levels, one of two scenarios may occur:
- Price Trend Reversal: When prices approach a support or resistance level, the market may experience a trend reversal.
- Price Breaks Through Support or Resistance: When prices break through these levels, it usually indicates a continuation or acceleration of the market trend.
These levels help traders set entry points, stop-loss points, and profit targets for their trades.
Types of Pivot Points
There are several types of pivot points, including Standard Pivot Points, Woodie Pivot Points, Camarilla Pivot Points, DeMark Pivot Points, and Fibonacci Pivot Points.
-
Standard Pivot Points: These are the most commonly used pivot points and are typically applied in stock, forex, and even cryptocurrency markets. They are calculated using the previous day’s high, low, and close prices. This method was originally used by floor traders in the futures market to help them determine support and resistance levels.
-
Woodie Pivot Points: Compared to Standard Pivot Points, Woodie Pivot Points place more emphasis on the closing price. This method is similar to weighted indices, where certain companies have a greater impact on the index, or like the Exponential Moving Average (EMA), which is more responsive to recent price changes than the Simple Moving Average (SMA).
-
Camarilla Pivot Points: This method is similar to Standard Pivot Points but provides four resistance levels and four support levels. The theory behind Camarilla Pivot Points is that prices tend to revert to the mean, so traders can buy at S3 and S4 levels and sell at R3 and R4 levels.
-
DeMark Pivot Points: The calculation of DeMark Pivot Points differs from other methods and typically provides only one support and one resistance level, often used to predict the high and low points of the current trading session.
-
Fibonacci Pivot Points: This method uses the common Fibonacci retracement levels (38.2%, 61.8%, and 100%) to calculate support and resistance levels.
How to Calculate Pivot Points
Each type of pivot point has its specific calculation method, usually involving the previous trading session’s high, low, and close prices. For example:
1. Standard Pivot Points Calculation Method
Standard Pivot Points are the most commonly used method, utilizing the previous day's market data to determine key price levels for the current day.
-
Pivot Point (PP):
where High, Low, and Close refer to the previous day's highest price, lowest price, and closing price, respectively.
-
First Resistance Level (R1):
-
First Support Level (S1):
-
Second Resistance Level (R2):
-
Second Support Level (S2):
-
Third Resistance Level (R3):
-
Third Support Level (S3):
These formulas provide key support and resistance levels that help traders identify potential reversal points or trend continuation areas.
2. Fibonacci Pivot Points Calculation Method
Fibonacci Pivot Points combine the standard Pivot Points with Fibonacci retracement levels, using Fibonacci ratios to determine support and resistance levels.
-
Pivot Point (PP):
-
First Resistance Level (R1):
-
First Support Level (S1):
Common Fibonacci ratios include 0.382, 0.5, and 0.618, which traders can select based on market volatility to calculate support and resistance levels.
3. Woodie Pivot Points Calculation Method
Woodie Pivot Points emphasize the influence of the opening price for the day and differ slightly from the standard Pivot Points.
-
Pivot Point (PP):
-
First Resistance Level (R1):
-
First Support Level (S1):
-
Second Resistance Level (R2):
-
Second Support Level (S2):
Woodie Pivot Points are particularly suitable for intraday trading as they give more weight to the opening price.
4. Camarilla Pivot Points Calculation Method
Camarilla Pivot Points, developed by Nick Stott, are used for trading in highly volatile markets. This method calculates closer support and resistance levels, making it suitable for short-term traders.
-
Pivot Point (PP):
-
Resistance Levels (R1 to R4):
-
Support Levels (S1 to S4):
In Camarilla Pivot Points, R3 and S3 are considered key reversal points, while R4 and S4 are extreme breakout points.
5. Tom DeMark's Pivot Points Calculation Method
Tom DeMark proposed a different Pivot Points calculation method that focuses on the relationship between the previous day's opening, high, and low prices.
-
Pivot Point (PP):
where X, Y, and Z are determined based on the previous day's market conditions:
- If Close < Open:
- If Close > Open:
- If Close = Open:
-
Support and Resistance Levels are calculated differently based on the PP formula, often including a simple moving average to smooth the data.
6. Intraday Pivot Points Calculation Method
Intraday Pivot Points are suitable for short-term traders, especially in high-frequency trading. They are typically based on the day's opening price, high, low, and current price.
-
Pivot Point (PP):
-
Real-Time Calculation: Intraday traders often update the high and low prices throughout the trading day and recalibrate the support and resistance levels based on the latest market data.
7. Monthly and Yearly Pivot Points Calculation Method
In addition to intraday and daily Pivot Points, there are longer-term Pivot Points, such as monthly and yearly Pivot Points, suitable for long-term investors or those looking to identify long-term trends.
-
Monthly Pivot Point:
-
Yearly Pivot Point:
These long-term Pivot Points can provide key support and resistance levels for identifying long-term market trends.
Using Pivot Point Indicators
On trading platforms like TradingView, traders can easily plot daily, weekly, or monthly support and resistance levels using built-in pivot point indicators. These indicators help traders visually identify key market levels and apply these pivot points across different time frames to formulate trading strategies.
Trading Strategies with Pivot Points
Pivot points are a crucial technical analysis tool widely used in various trading strategies. The following are some common pivot point trading strategies, enriched with detailed analysis to help traders better understand how to apply these strategies in actual trading.
1. Market Sentiment Assessment Strategy
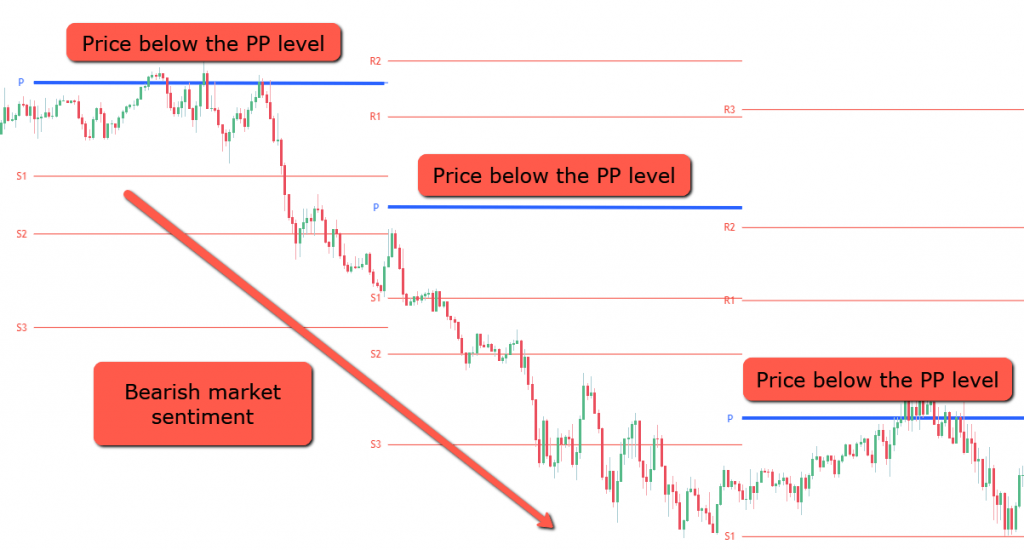
Pivot points can help traders quickly assess market sentiment and determine the market's bullish or bearish trends.
-
Strategy Concept: When prices are trading above the pivot point (PP), the market tends to be bullish; when prices are below the pivot point, the market tends to be bearish. Traders can take corresponding long or short positions based on this assessment.
-
Entry Strategy: If the price is above the pivot point and approaching resistance levels (R1, R2, or R3), consider going long; conversely, if the price is below the pivot point and nearing support levels (S1, S2, or S3), consider going short.
-
Stop Loss and Take Profit: When going long, the stop loss can be set below the pivot point near the support level (e.g., S1) or the previous low; when going short, the stop loss can be set above the resistance level. Take profit can be adjusted based on the strength of resistance or support levels and market trends.
2. Trend-Following Strategy
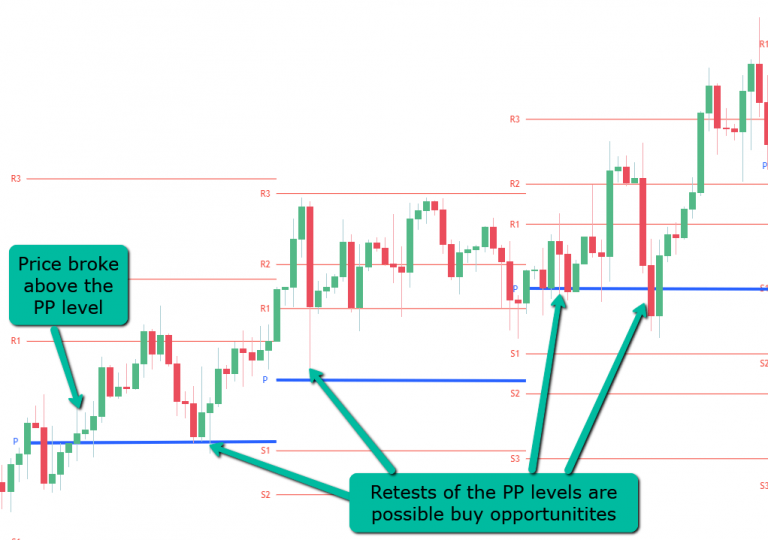
In strong trending markets, pivot points can help traders find entry opportunities in line with the trend.
-
Strategy Concept: Traders can use pivot points as reference points for entering and adding positions. When the market trend is strong, and prices break above the pivot point, traders can enter on pullbacks to the pivot point, trading in the direction of the trend.
-
Entry Strategy: In an uptrend, when prices break above the pivot point and pull back to its vicinity, traders can look for buying opportunities near the support level (e.g., S1); in a downtrend, when prices break below the pivot point and bounce back, selling opportunities can be found near the resistance level (e.g., R1).
-
Stop Loss and Take Profit: In trend-following trading, the stop loss can be set below the pullback low or the previous support level, and take profit can be set based on market momentum and the strength of resistance levels (e.g., R2, R3).
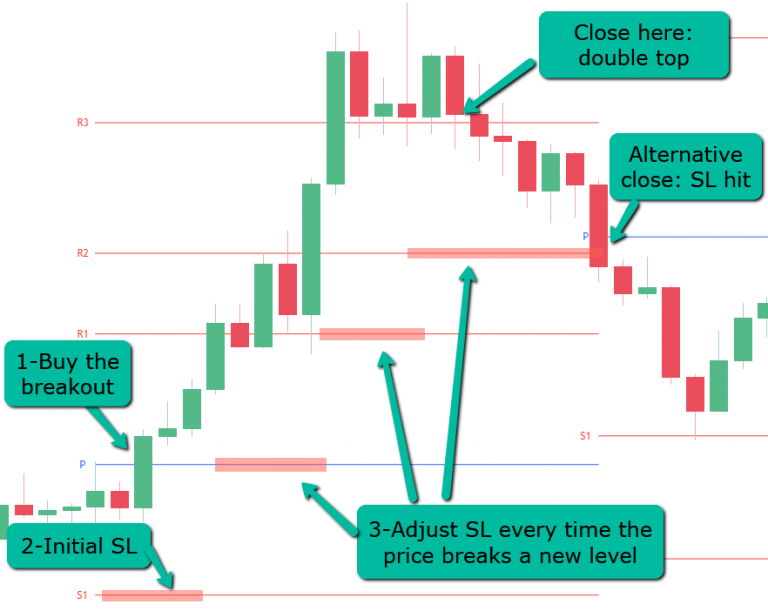
3. Breakout Trading Strategy
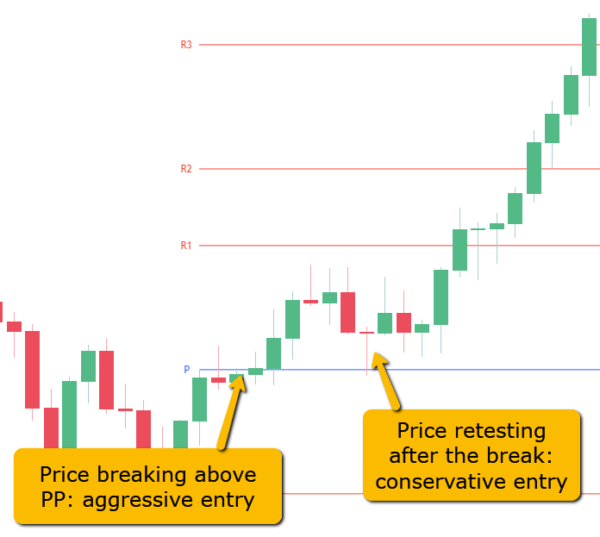
The breakout trading strategy primarily leverages the behavior of prices breaking through pivot points to capture significant market moves.
-
Strategy Concept: When prices break through key support or resistance levels (usually R1, R2, or S1, S2), it indicates that the market may experience a strong directional move. Traders can profit by following the breakout direction.
-
Entry Strategy: When prices break through resistance levels R1 or R2, traders can consider buying above the breakout point, taking advantage of the strong continuation of prices; when prices break below support levels S1 or S2, traders can sell below the breakout point.
-
Stop Loss and Take Profit: The stop loss can be set below the breakout level (e.g., below R1 near the pivot point), and take profit can be adjusted based on the strength of the market movement and the distance to the next resistance level (e.g., R3).
4. Range Trading Strategy
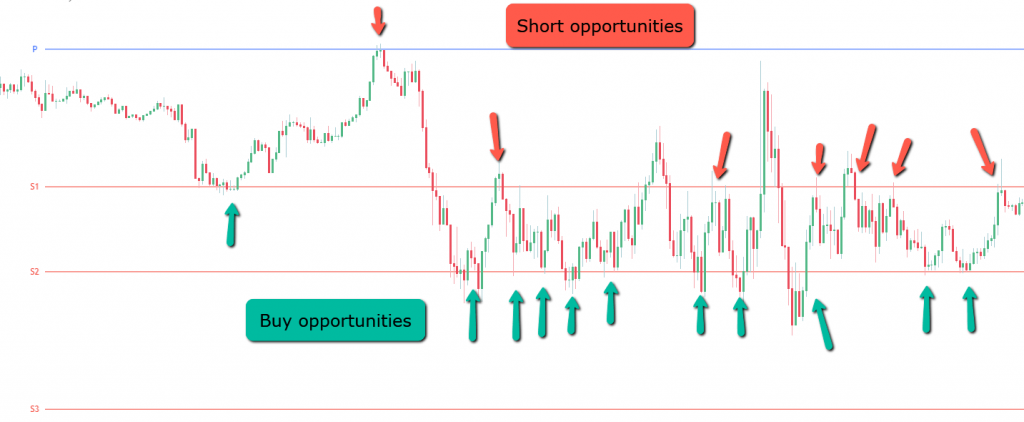
In low-volatility or range-bound markets, pivot points effectively help traders conduct range trading between support and resistance.
-
Strategy Concept: When the market lacks a clear trend direction and moves within a relatively narrow range, pivot points provide clear support and resistance levels. Traders can use these levels to buy low and sell high.
-
Entry Strategy: When prices approach support levels (e.g., S1 or S2), traders can consider buying and selling when prices approach resistance levels (e.g., R1 or R2); conversely, when prices approach resistance levels, traders can consider selling and buying back near support levels.
-
Stop Loss and Take Profit: The stop loss can be set near the support or resistance levels (e.g., S1 or R1) to prevent losses from a potential breakout. Take profit can be set at the opposite resistance or support level, depending on the range's size.
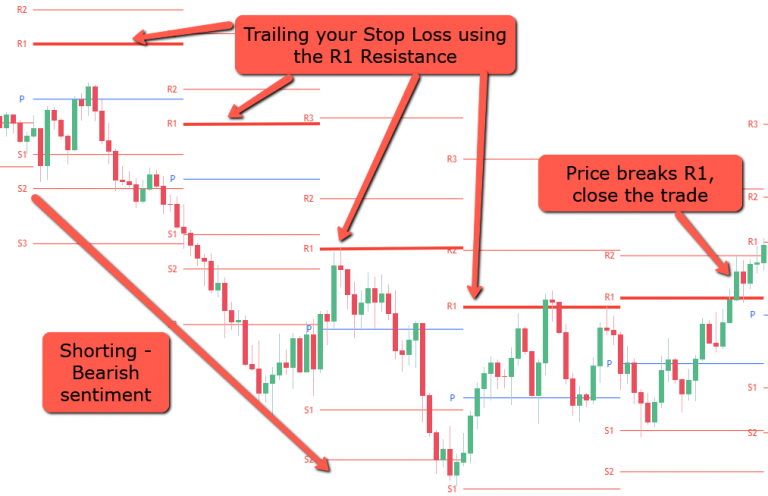
5. Trailing Stop Strategy
Pivot points can also serve as reference points for trailing stops, helping traders lock in profits while reducing risk.
-
Strategy Concept: In a profitable position, as prices gradually approach or break through various pivot point levels, traders can adjust the stop loss by moving it up or down according to new pivot points or support/resistance levels to maximize profits.
-
Entry Strategy: This strategy applies to existing positions. After prices break through a resistance level (e.g., R1), the stop loss can be gradually moved to the pivot point (PP) or the previous support level (e.g., S1) to protect profits.
-
Stop Loss Adjustment: Stop loss positions should be adjusted at the end of each trading day or week according to the new pivot point levels to ensure that profits are preserved if the market reverses.
6. Reversal Trading Strategy
The reversal trading strategy utilizes pivot points to identify potential market reversal points.
-
Strategy Concept: When prices approach extreme support levels (e.g., S3, S4) or resistance levels (e.g., R3, R4) near pivot points, the market may reverse. These extreme levels often represent oversold or overbought conditions, signaling a potential reversal.
-
Entry Strategy: Traders can enter when prices approach or touch these extreme support or resistance levels, expecting a market reversal. For example, when prices approach S3 or S4, consider buying; when prices approach R3 or R4, consider selling.
-
Stop Loss and Take Profit: Stop loss can be set beyond the extreme levels to prevent further adverse price movements; take profit can be set at intermediate pivot levels or the next support/resistance level to ensure appropriate profits if the reversal is successful.
Conclusion
Pivot points are an invaluable tool in trading, capable of automatically plotting support and resistance levels with simple mathematical calculations. When traders understand the significance of these levels and how prices react to them, they can improve their trading accuracy. The best results often arise when pivot points are combined with other technical indicators, such as moving averages.
Disclaimer: The views in this article are from the original Creator and do not represent the views or position of Hawk Insight. The content of the article is for reference, communication and learning only, and does not constitute investment advice. If it involves copyright issues, please contact us for deletion.


![[2023 Forecast] Jumia Technologies Stock](https://hawk-oss.hawkinsight.com/hawk/image/20231128/图片1_2390420139_338.png?w=3840&q=100)