Black Marubozu Candlestick Pattern - What Is And How To Trade
Learn all about the Black Marubozu candlestick pattern.What is, how to trade, and all the best trading strategies.
The Black Marubozu is a significant bearish reversal pattern widely used in technical analysis to identify potential market reversal points. This comprehensive analysis covers the definition of the Black Marubozu candlestick pattern, identification methods, trading strategies, and success rates.
Definition of Black Marubozu Candlestick Pattern
The Black Marubozu is a bearish reversal pattern typically occurring after a price increase, indicating a rejection of higher prices. This pattern suggests that the market might experience a bearish reversal. It is the mirror image of the White Marubozu, representing strong selling pressure.
How to Identify the Black Marubozu Candlestick Pattern
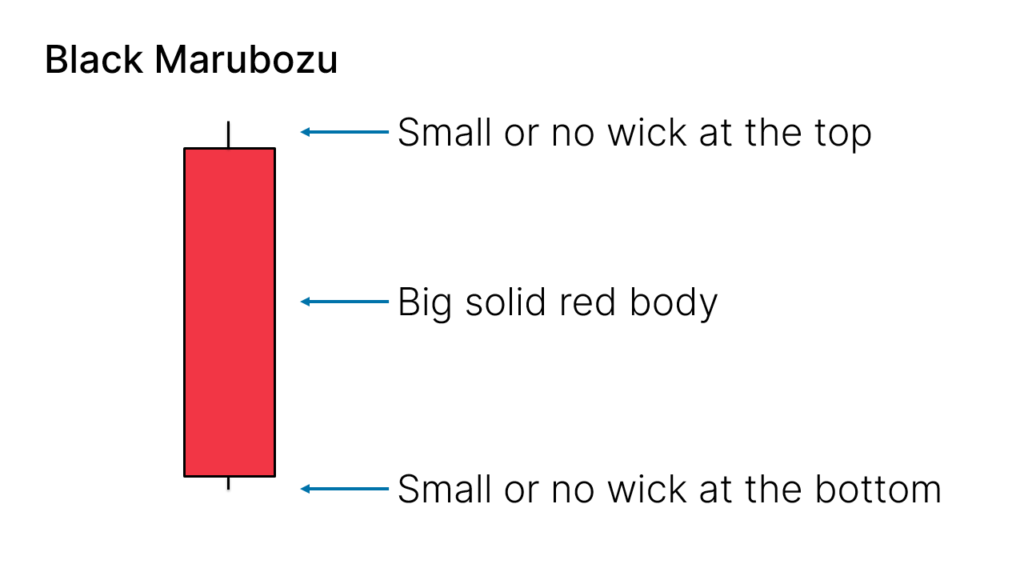
To accurately identify the Black Marubozu, focus on the following aspects:
- Single Bearish Candlestick: The pattern should consist of only one candlestick and it should be bearish.
- Large Solid Body: The body of the candlestick should be significantly larger than the wicks, indicating strong market selling pressure.
- Short Wicks: The upper and lower wicks should be as short as possible or completely absent, showing that the market price did not rise significantly.
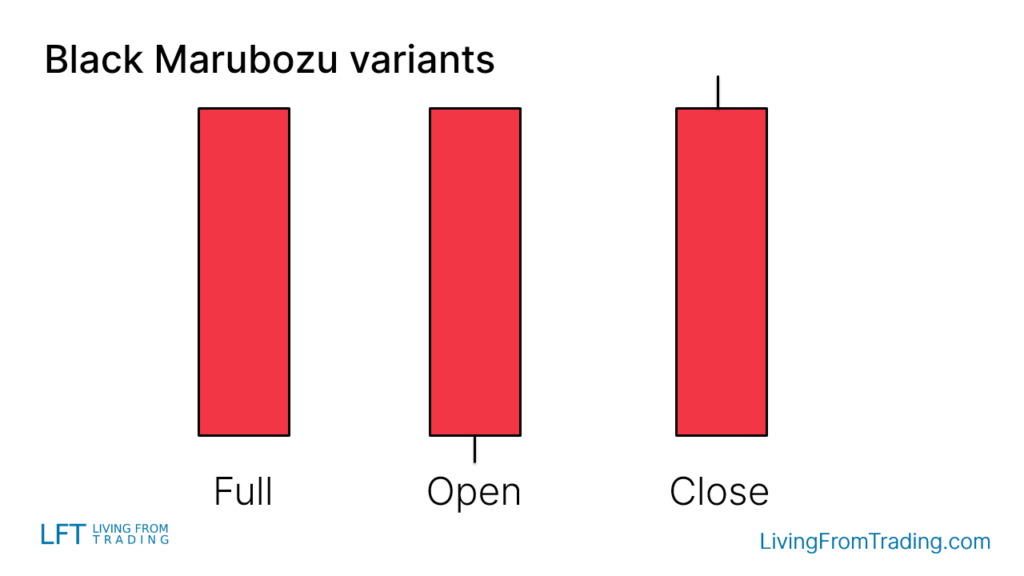
Variants of the Black Marubozu Candlestick Pattern
- Full Black Marubozu: Completely devoid of upper and lower wicks, with the body occupying the entire candlestick.
- Open Black Marubozu: No upper wick, but with a small lower wick.
- Close Black Marubozu: No lower wick, but with a small upper wick.
Trading Strategies
When trading the Black Marubozu, it is crucial to not only recognize the pattern but also consider its occurrence location and market environment. Here are several effective trading strategies:
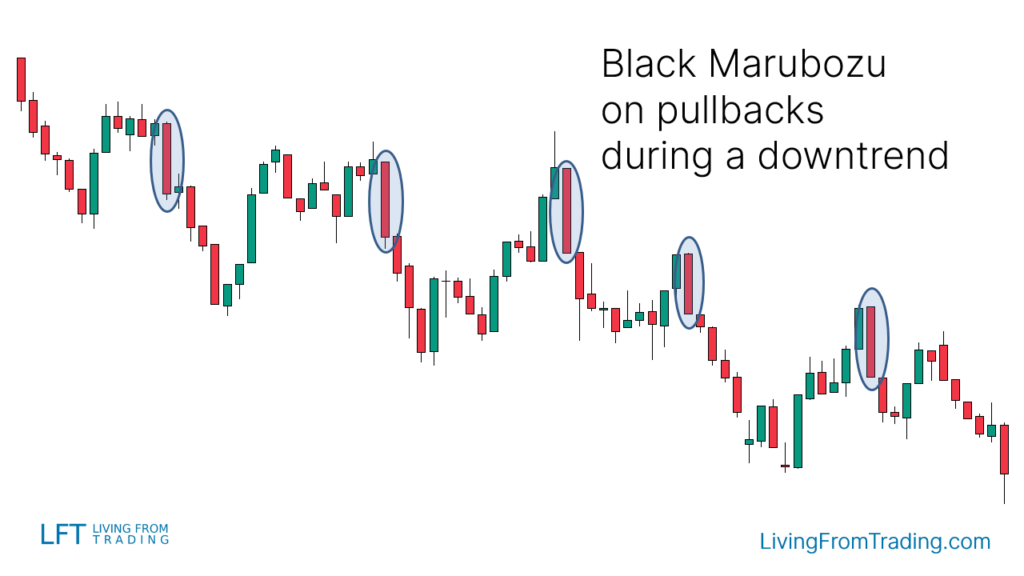
Strategy 1: Trading on Naked Charts
Background: As a bearish reversal pattern, the Black Marubozu is suited for use during a downtrend.
Action: Wait for a market price retracement and observe the appearance of a Black Marubozu at the end of the retracement. This pattern usually signals the continuation of the downtrend.
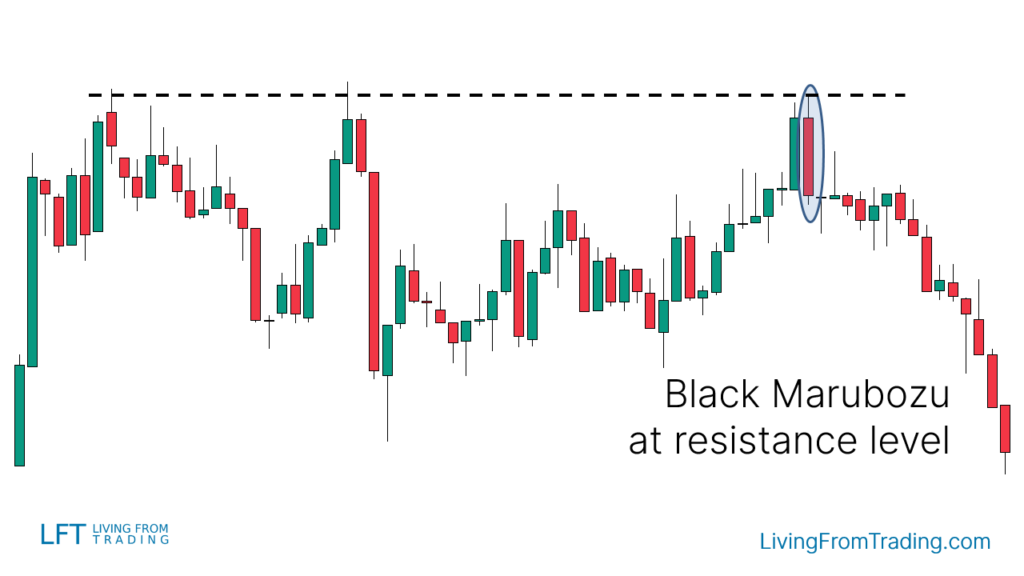
Strategy 2: Trading with Resistance Levels
Background: Resistance levels are significant areas where price reversals are likely, making the Black Marubozu at these levels more reliable.
Action:
- Mark major resistance levels on the chart.
- Wait for the price to rise and reach these resistance levels.
- If a Black Marubozu appears at the resistance level, consider shorting.
- Set stop-loss above the high of the Black Marubozu and target price levels.
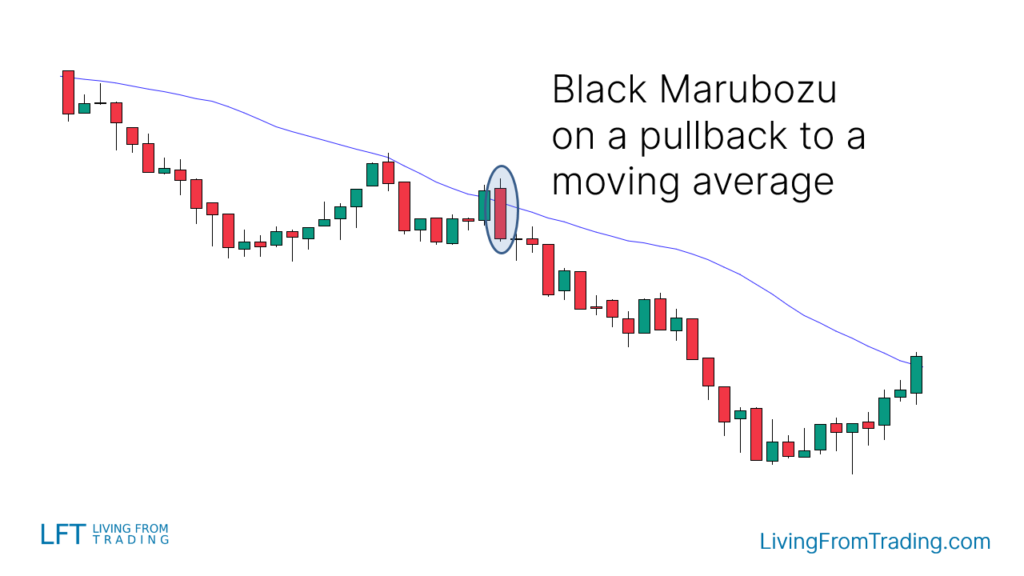
Strategy 3: Trading with the Moving Averages
Background: Moving averages help confirm trend strength and reversal points.
Action:
- Determine if the market is in a downtrend and the price is below the moving average.
- Wait for the price to rise to near the moving average and observe the appearance of a Black Marubozu.
- Short when the price falls below the Black Marubozu’s low, setting stop-loss and target price levels.
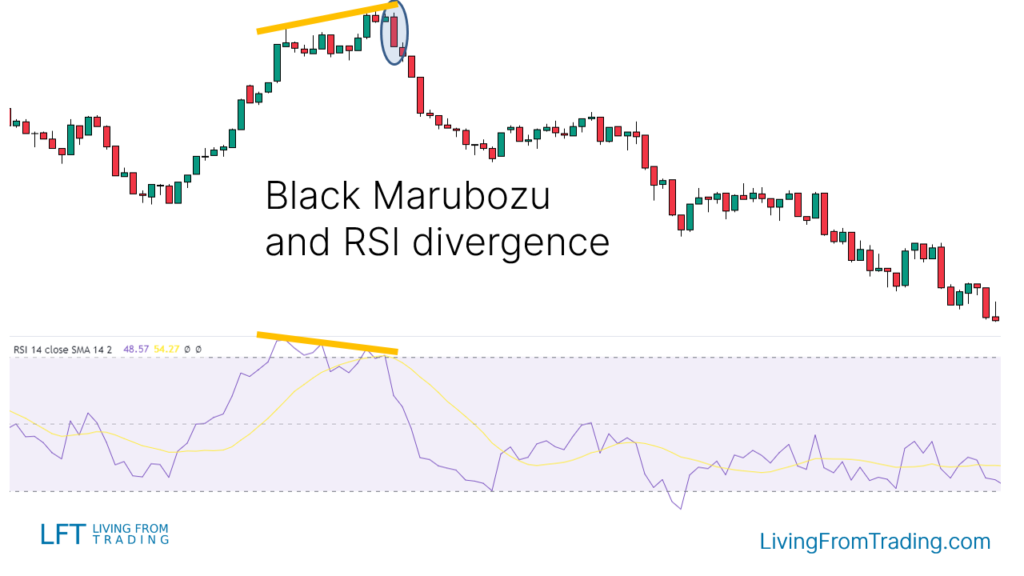
Strategy 4: Trading with RSI Divergence
Background: RSI divergence can signal early market reversals.
Action:
- Observe price highs and RSI indicator during an uptrend.
- If the price reaches a new high but the RSI fails to do so, forming an RSI divergence.
- If a Black Marubozu appears near this divergence, consider shorting.
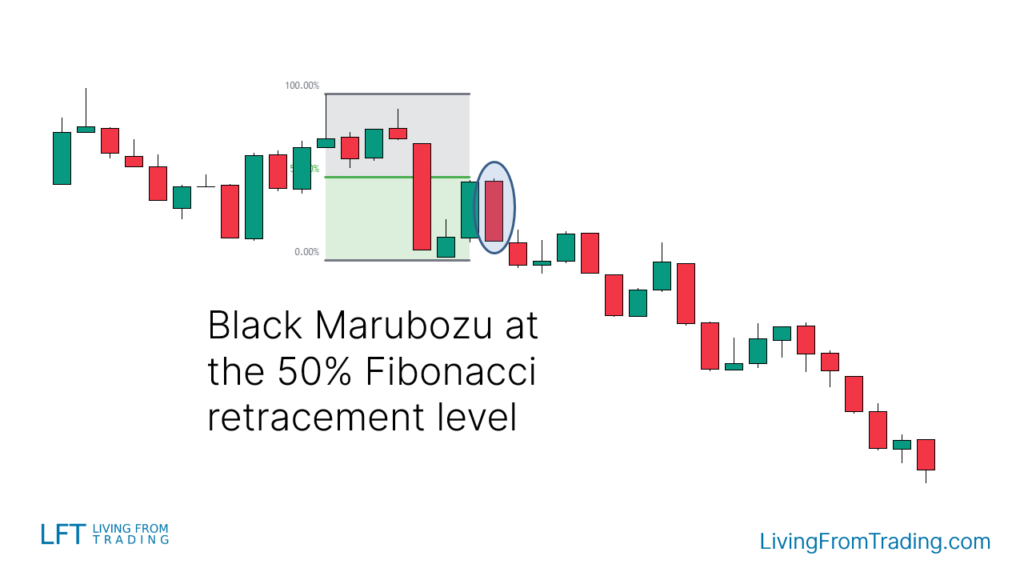
Strategy 5: Trading with Fibonacci
Background: Fibonacci retracement levels help identify potential reversal areas.
Action:
- Apply the Fibonacci tool during a downtrend and mark key retracement levels.
- Wait for the price to rise to Fibonacci levels and observe the appearance of a Black Marubozu.
- Short when the price falls below the Black Marubozu’s low, setting stop-loss and target price levels.
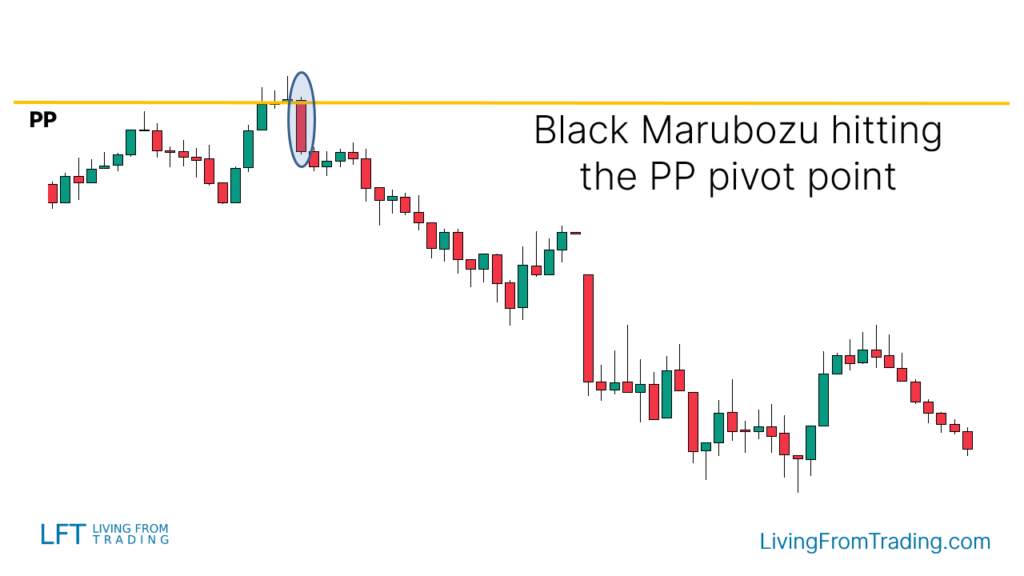
Strategy 6:Trading with Pivot Points
Background: Pivot points are automatically calculated support and resistance levels.
Action:
- Activate the pivot point indicator on the chart.
- Check if the price is approaching resistance levels above the pivot points.
- If the price rises to these pivot points and a Black Marubozu appears, consider shorting.
Conclusion
Black Marubozu is known to have a success rate of 54 per cent. This indicates that the Black Marubozu chart is moderately effective when applied to the market and that its accuracy can be improved in combination with other analytical tools.
Black Marubozu is a single bearish candlestick, which usually appears after a price rise, signalling a possible downward reversal. To trade the Black Marubozu effectively, one should pay attention to the location and market environment in which it occurs and combine it with technical analysis tools such as retracements, moving averages, RSI divergence, Fibonacci and pivot points.
Disclaimer: The views in this article are from the original Creator and do not represent the views or position of Hawk Insight. The content of the article is for reference, communication and learning only, and does not constitute investment advice. If it involves copyright issues, please contact us for deletion.
![[2023 Forecast] Amigo Stock](https://hawk-oss.hawkinsight.com/hawk/image/20231128/图片1_2390728484_528.png?w=3840&q=100)