Evening Star Candlestick Pattern - What Is And How To Trade
Learn all about the Evening Star candlestick pattern.What is, how to trade, and all the best trading strategies.
The "Evening Star" candlestick pattern is a classic bearish reversal pattern widely used in technical analysis. This article provides a comprehensive guide to understanding the Evening Star pattern, including its definition, identification methods, variants, and trading strategies, with detailed examples for better insight.
Overview
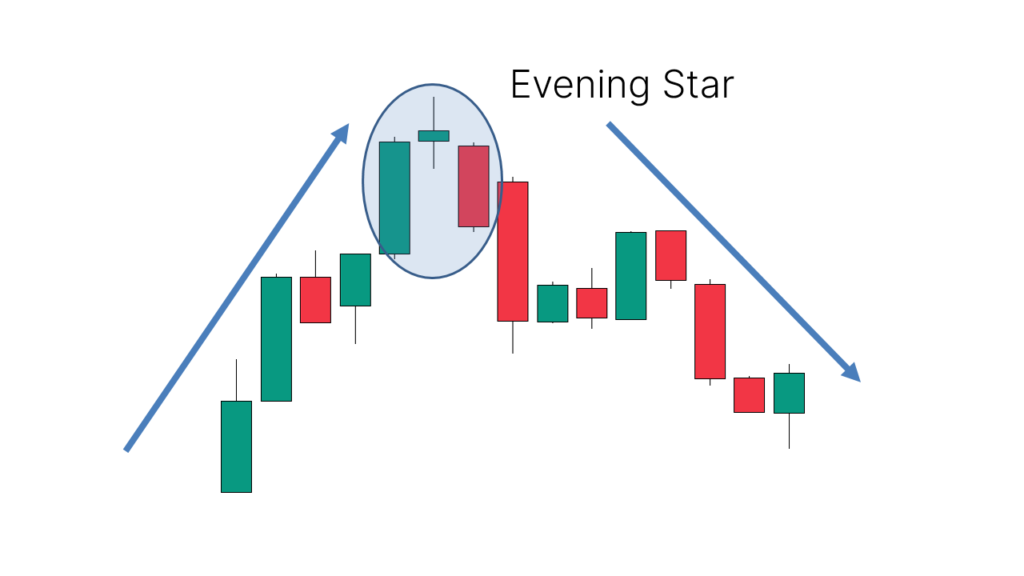
Definition:The Evening Star is a bearish reversal candlestick pattern that typically appears after a price uptrend. Its formation signals a potential downturn, indicating the end of an uptrend and the possibility of a new downtrend. The pattern is a mirror image of the Morning Star candlestick pattern, representing a reversal signal at the peak of an uptrend.
Pattern Characteristics:
- Bearish Signal: Indicates potential price decline.
- Reversal Pattern: Appears after an uptrend, suggesting the end of the bullish trend.
How to Identify the "Evening Star" Candlestick Pattern
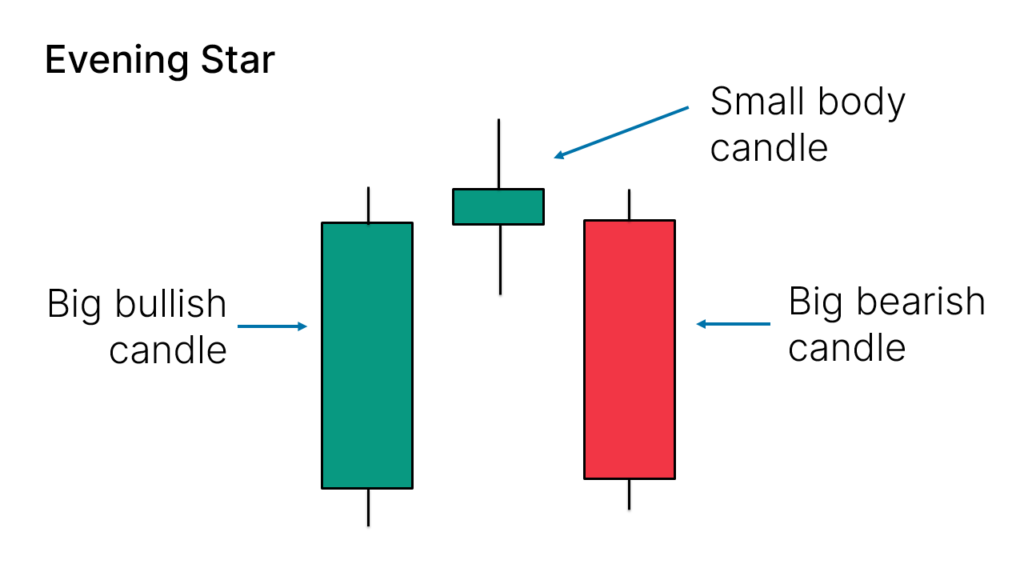
The Evening Star candlestick pattern consists of three candles. Here’s how to identify it:
- First Candle: A bullish candlestick, indicating a continuing uptrend, usually with a long body.
- Second Candle: A small-body candlestick, such as a Doji or Spinning Top, showing market indecision. The color of this candle is not important.
- Third Candle: A bearish candlestick, with a long body, indicating a price decline, often contrasting with the first candle’s body.
Ideal Conditions:
- The second candle should have a smaller body compared to the other two.
- The body of the second candle should not overlap with the bodies of the other two candles.
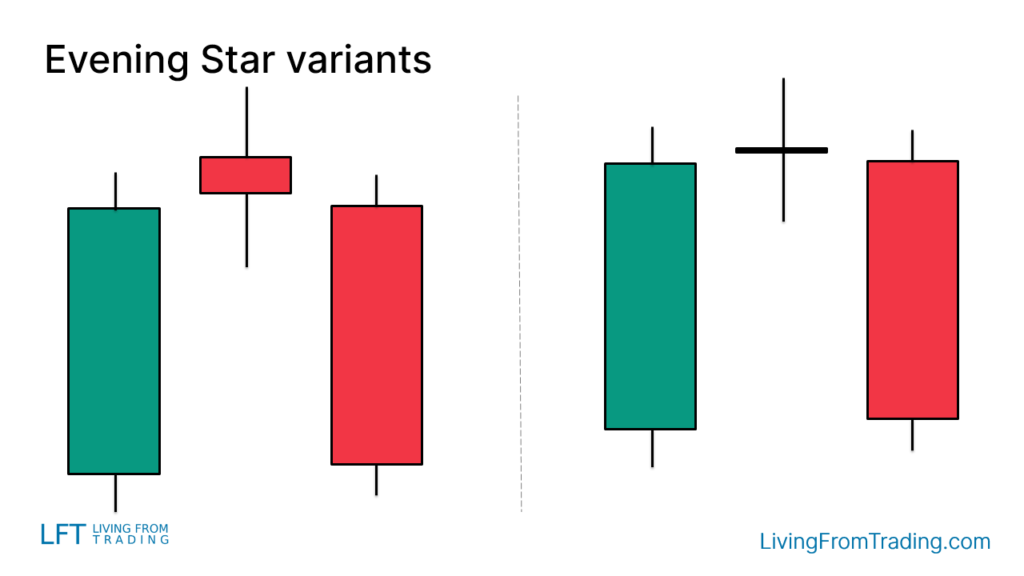
Variants of the "Evening Star" Candlestick Pattern
In practice, the Evening Star pattern may appear with variations:
- Color of the Second Candle: Can be either red (bearish) or green (bullish), or even a Doji with no body.
- Pattern Form: The appearance may vary but should maintain the overall three-candle structure.
How to Trade
Trading the Evening Star pattern involves more than just recognizing the pattern. Its effectiveness depends on its location and the use of additional technical analysis tools. Here are detailed trading strategies:
1. Confirm Reversal Signal:
- Market Condition: Ensure the Evening Star appears after an uptrend to validate it as a bearish reversal.
- Trade Trigger: Enter a short position when the low of the third candle is broken.
2.Stop Loss Setup:
- Stop Loss Placement: Typically set above the pattern, such as above the second candle, to guard against unexpected market movements.
Trading Strategies
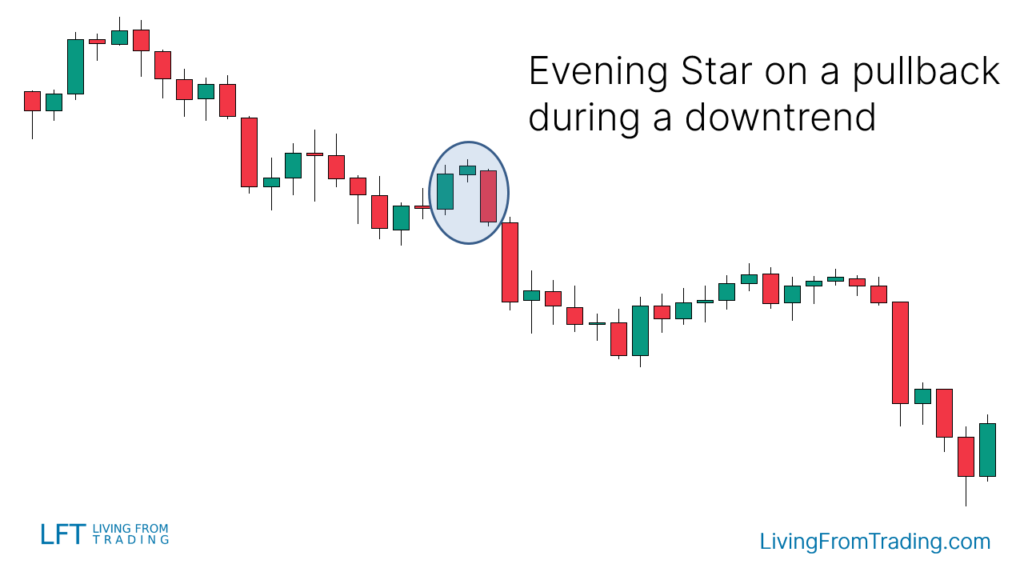
Strategy 1: Pullbacks on Naked Charts
- Market Condition: Ideal for a downtrend; wait for a pullback and then observe the formation of the Evening Star.
- Trading Signal: The appearance of the Evening Star often signals the end of the pullback and the beginning of a new downtrend.
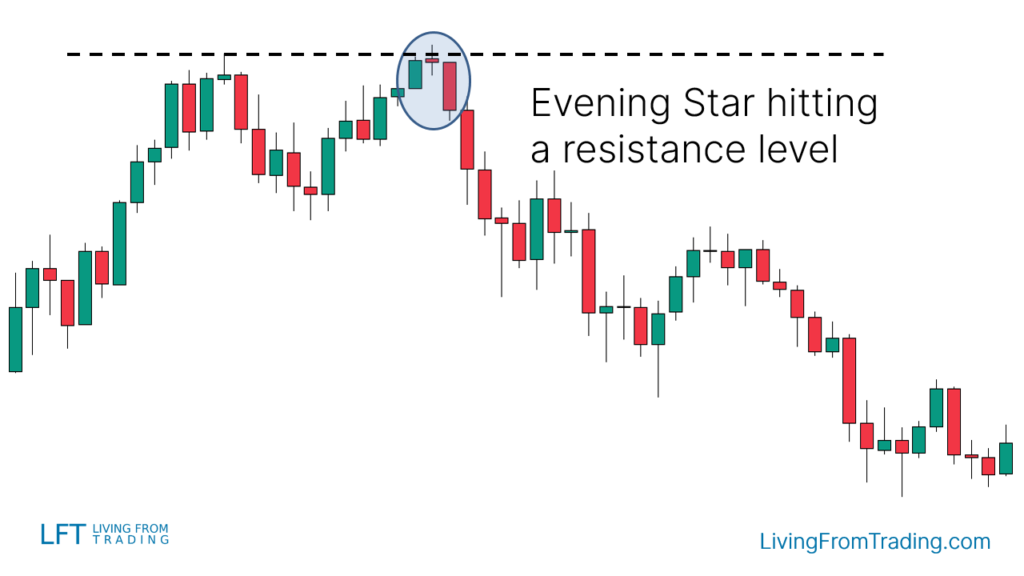
Strategy 2: Trading with Resistance Levels
- Resistance Level Identification: Draw resistance levels on the chart.
- Trading Signal: When the price hits a resistance level and forms an Evening Star, short when the price breaks the low of the last candle of the Evening Star.
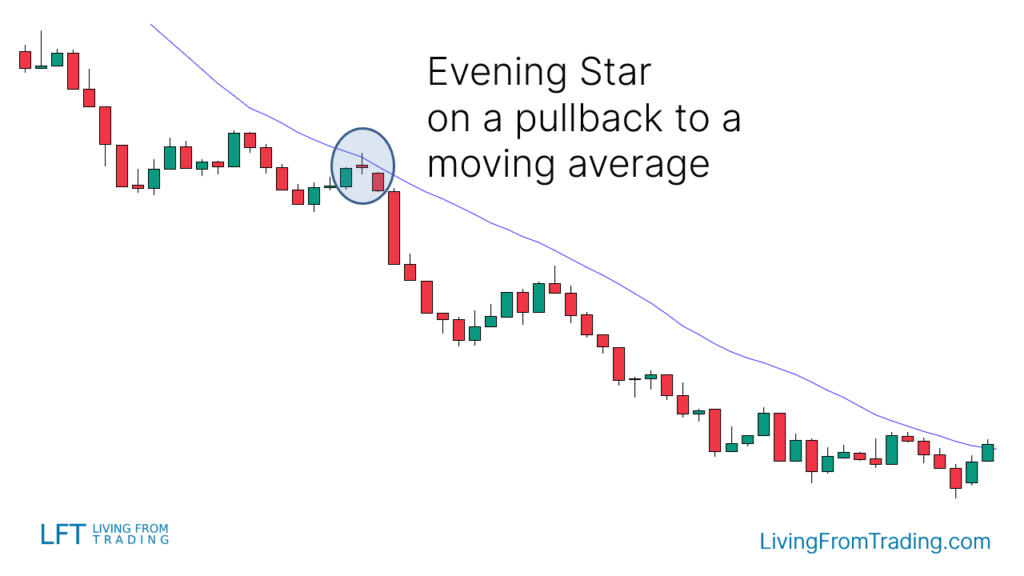
Strategy 3: Trading with Moving Averages
- Moving Average Use: Identify trends using moving averages.
- Trading Signal: In a downtrend, wait for a price move to touch the moving average and form an Evening Star. Short when the price breaks the low of the last candle.
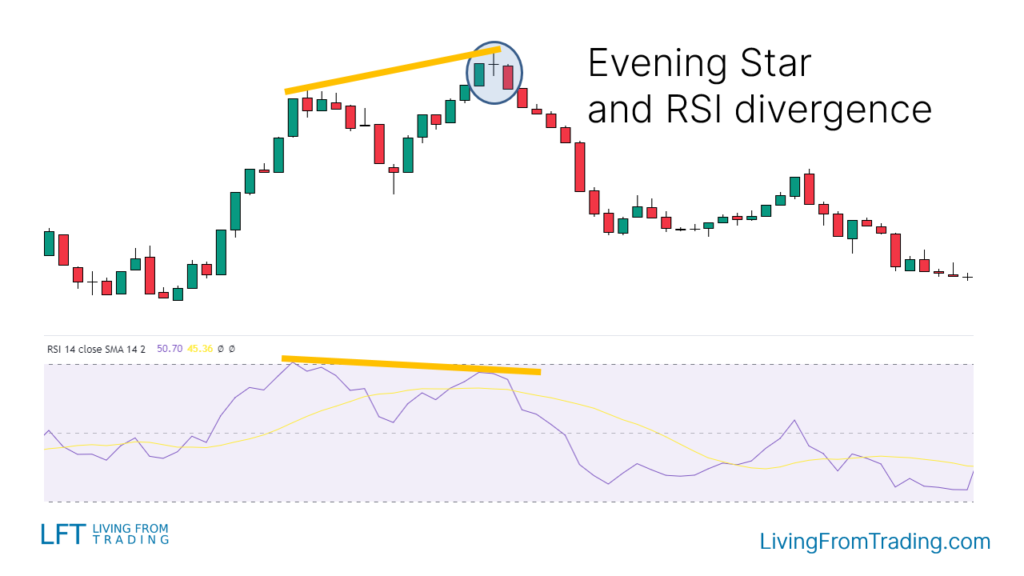
Strategy 4: Trading with RSI Divergences
- RSI Divergence: Look for bearish divergence where price makes higher highs while RSI makes lower highs.
- Trading Signal: When an Evening Star forms at a higher high aligned with an RSI lower high, short when the low of the last candle is broken.
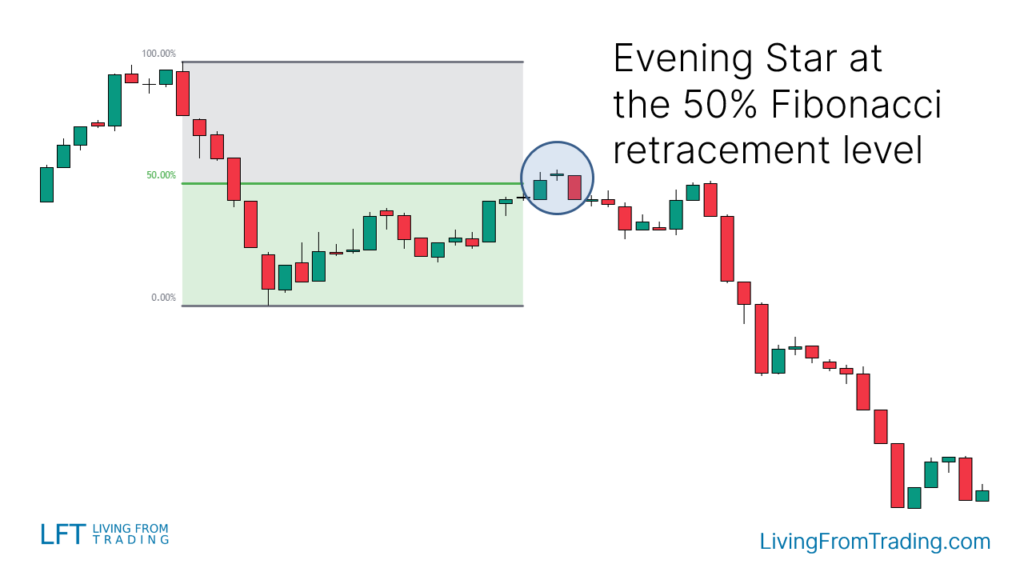
Strategy 5: Trading with Fibonacci Retracement
- Fibonacci Tool: Identify retracement levels.
- Trading Signal: During a downtrend, wait for a price move up to a Fibonacci level. If an Evening Star forms at this level, short when the low of the last candle is broken.
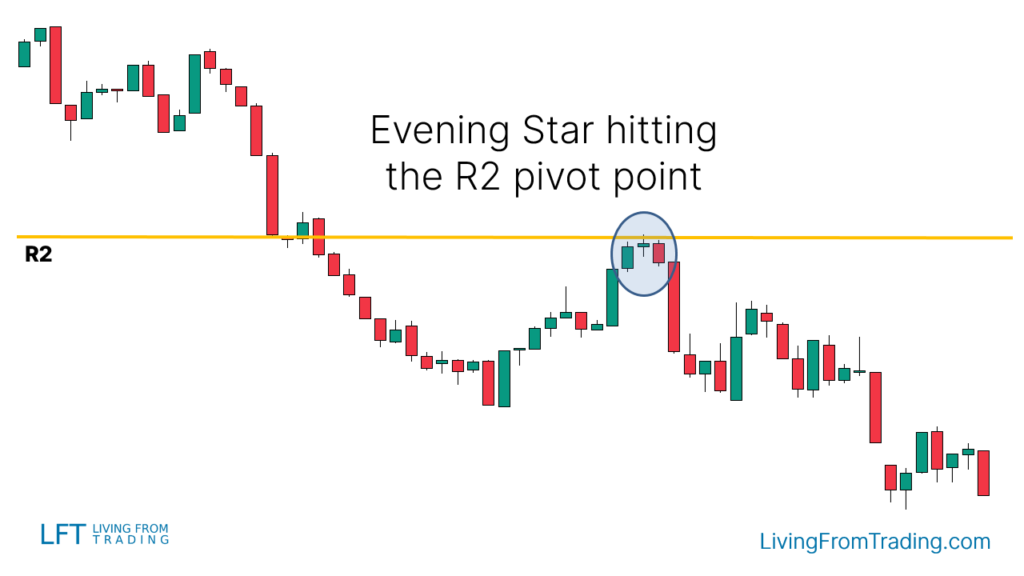
Strategy 6: Trading with Pivot Points
- Pivot Points: Use pivot points to identify support and resistance levels.
- Trading Signal: When the price rises to a Pivot Point level and forms an Evening Star, short when the low of the last candle is broken.
Summary
Evening Star candlestick pattern has a success rate of 71%. This indicates a relatively high probability of a bearish reversal when the pattern is correctly identified and used.
The "Evening Star" candlestick pattern is a powerful technical analysis tool for identifying potential market reversals. By accurately recognizing the pattern and applying various trading strategies and technical indicators, traders can significantly improve their trading accuracy and success rates. Understanding its success rate and effectively integrating different strategies will help traders achieve better investment returns.
Disclaimer: The views in this article are from the original Creator and do not represent the views or position of Hawk Insight. The content of the article is for reference, communication and learning only, and does not constitute investment advice. If it involves copyright issues, please contact us for deletion.