How to get XM exclusive technical indicators
XM offers exclusive indicators。They can help you analyze trends, volatility, support / resistance, and determine timing。

XM is a leading multi-asset online trading platform based in Cyprus.。We are committed to providing a safe, transparent and efficient trading environment for global investors and providing customers with a variety of financial products trading services.。
XM offers traders exclusive indicators when it comes to trading analysis。These XM technical indicators were developed in collaboration with experienced trader Avramis Despotis。
◇ Ribbon indicators:Help identify current trends and determine the right time to enter the market。
The River indicator:Identify market direction and identify tools that are growing momentum。
◇ Ichimoku indicators:Helps establish support and resistance levels while defining trend direction。
◇ Bollinger Bands Indicator:Assess price volatility and predict potential market trends。
◇ ADX and PSAR indicators:Helps with the strength of the trend and identifies points where a turn may occur。
◇ AnalyzeDissector: Facilitate automated analysis of various indicators。
They work perfectly with MT4 and MT5 and you can even use them to create expert advisors or robots。
How to get XM technical indicators?
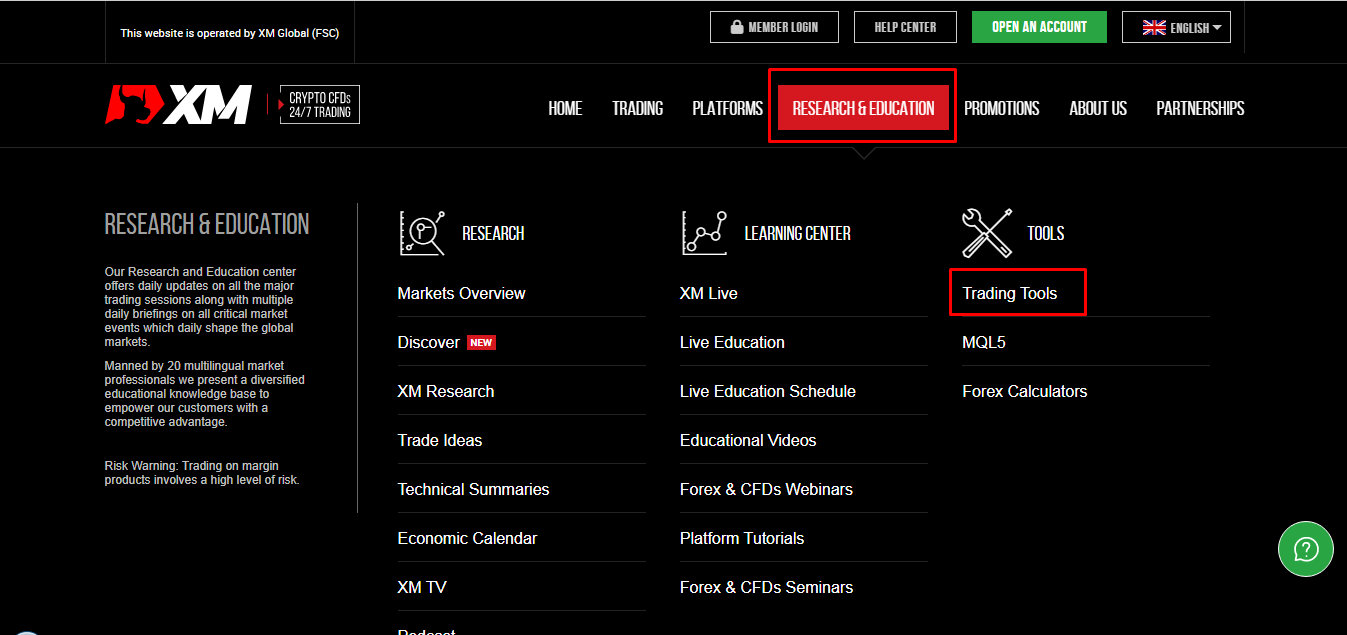
1, want to get these XM exclusive technical indicators, please register XM account。Go to the official XM page and select "Research & Education" at the top"and select" trading tools”。
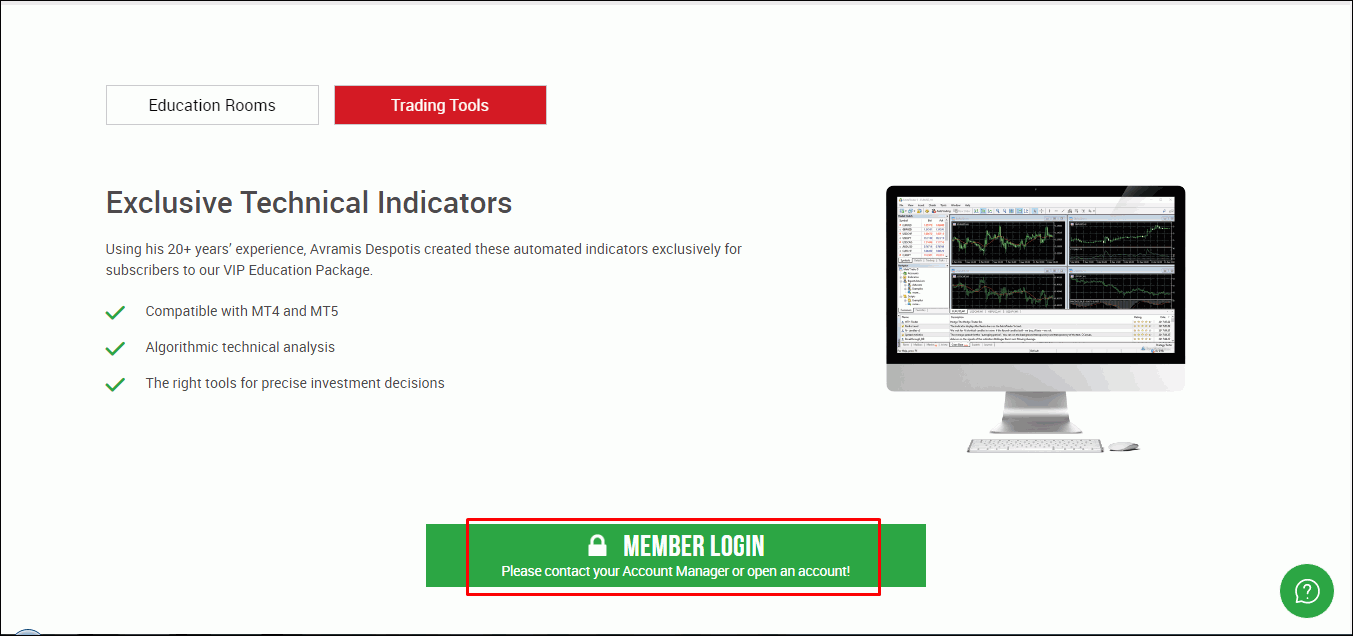
2. Enter the trading tools page and click "Member Login" in the central green box.。This will take you to the registration or new XM account opening page。Fill in all the information required to open an account。
After successful registration, you will receive a call from the XM account manager.。In this call, an exclusive indicator can be requested。
Don't worry if you miss your account manager's call。You will receive an email from support or a call from another account manager。Remember this contact number, which usually starts with 021。If you can't remember your account manager's phone email, just go to XM Online Chat and ask them to contact you。
For users who already have an XM account, please contact customer service directly。Request to chat with customer service。
The account manager will tell you what you need to do to get these MetaTrader indicators。Once this is done, the account manager will guide you through the operation。If you meet the deposit requirements, you can apply for multiple XM trading instruments。
General requirements
The general requirement is that you deposit $250 to access the LITE function for each XM indicator。For PRO function, each indicator needs to be deposited $500 (applied by multiple and calculated by account, valid for 2 weeks after deposit)。
The difference between LITE and PRO is that LITE can only load one chart。PROCan load 2-3 charts simultaneously。Only standard information is displayed in LITE, while PRO provides additional analysis。
Ribbon Indicator for XM
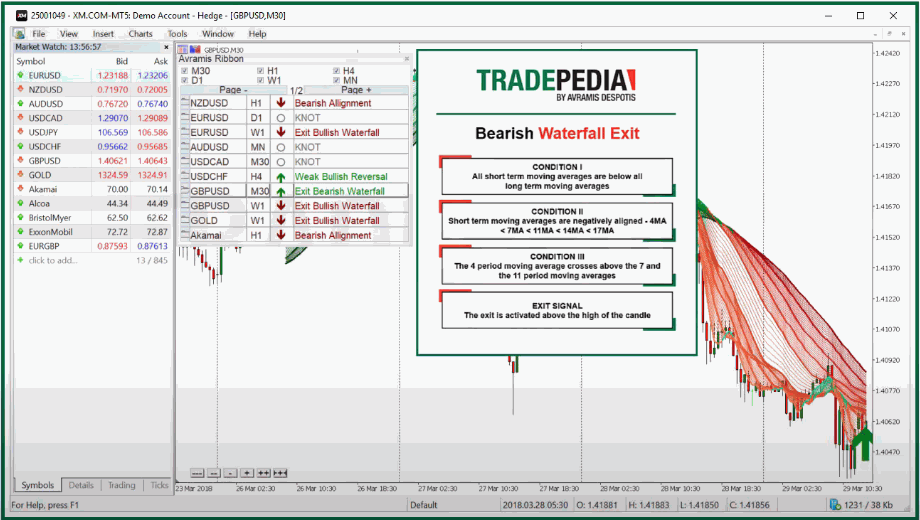
The Ribbon indicator helps to spot current trends and determine the right time to enter the market。It is lower by combining ten moving averages of different time frames.。
How to arrange automatic pop-up reminders based on these moving averages。This indicator can alert you in advance when you are likely to break the trend or if it is a good time to stick to it。
Using the Ribbon indicator from XM, you can do the following:
1, use the queue moving average to adhere to the trend.。Just observe the candle line-if the price is above, it is an upward trend, if it is below, the recovery trend is still going on。
2. Find important consolidation areas and determine the timing of entry when a breakthrough occurs。Check where prices rise and fall along the candle line - this is consolidation。When prices break out and continue to fluctuate (whether up or down), it's time to enter the market。
3. Capture signals that show that the trend continues。Similar to point 1, as long as the price stays above or below the candle line, the trend will continue。
4. Quick tools and find clues when to enter。You can view an overview table summarizing all ribbon signals for multiple viewing tools selected。This gives you the opportunity to see other currency pairs while consuming a look at each chart one by one。
River indicator for XM
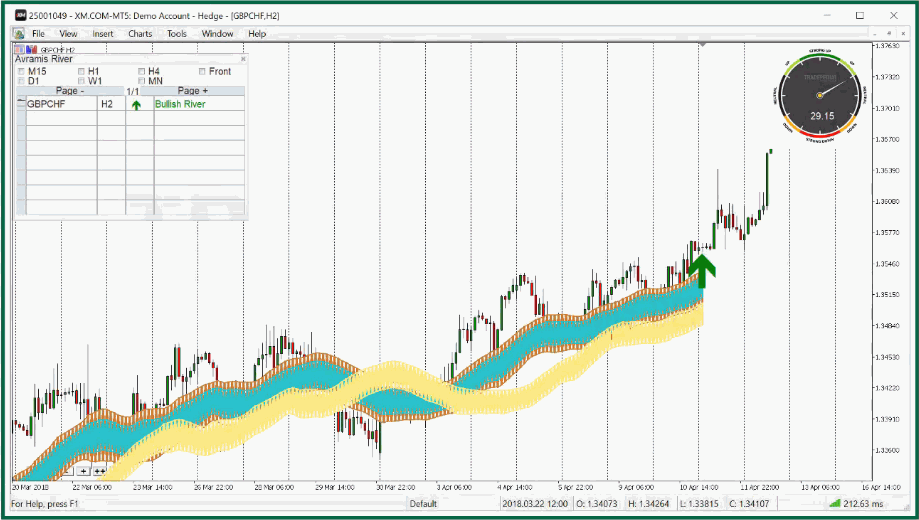
The River indicator is a powerful tool to help you understand where the market is going and which tools are really changing。It's not just the trend, it's looking at the trend, the strength and the breadth of the trend。
In fact, the River indicator combines different factors such as moving averages, market excitement and how prices relate to them。
Here's what the XM River indicator can do for you:
1. Easily identify interval patterns:River Indicator is ideal for discovering range patterns in the market, allowing you to easily see when prices are stable or active。
Replace multiple indicators with one indicator:Instead of using a bunch of tools to understand trends, the river indicator combines all this information into one easy-to-use tool。This makes it easier to understand where the market is headed.。
Tools to detect really strong trends:You can compare the signals of multiple currency pairs in the overview table, and then visit each chart to draw conclusions about overall market conditions。
Ichimoku indicator for XM
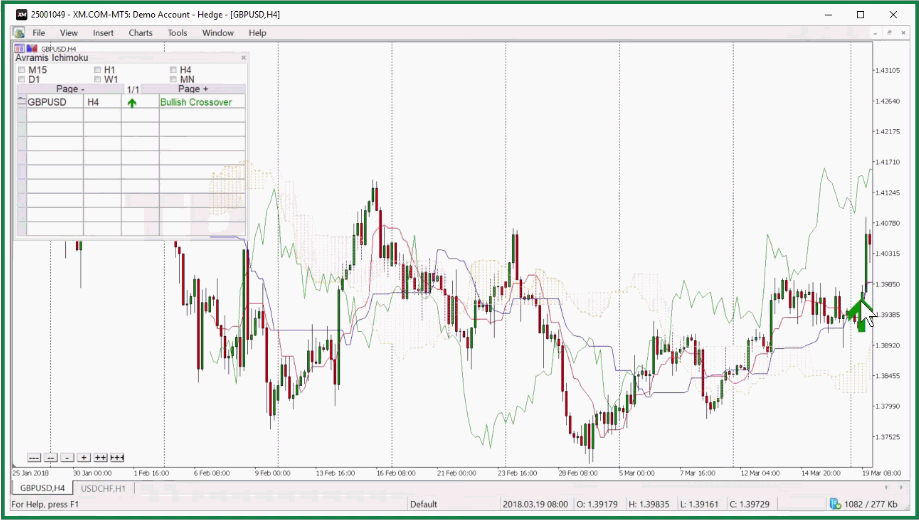
Ichimoku indicator helps you define support / resistance and determine trend direction。It also helps with fast pacing and provides buy / sell signals。
Using the XM Ichimoku indicator, you can do the following:
Find the target market:You can achieve this by observing the relationship between the cloud chart and the moving price; a clear upward trend when the price is away from the cloud, and a downward trend when the price is below the clear cloud。
Check out the timing of a possible price rally:In this case, the cloud chart indicates the level of the rebound point.。
Decide on the timing of admission:Focus on signals such as price ingredients and the launch of Tenkan-sen, Kijun-sen or TK cross-trends。
Effectively view other tools:You can take a quick look at the many tools and find tips on when it is appropriate to enter from the overview table in the upper left corner of the chart。
XM'sRibbonIndicators
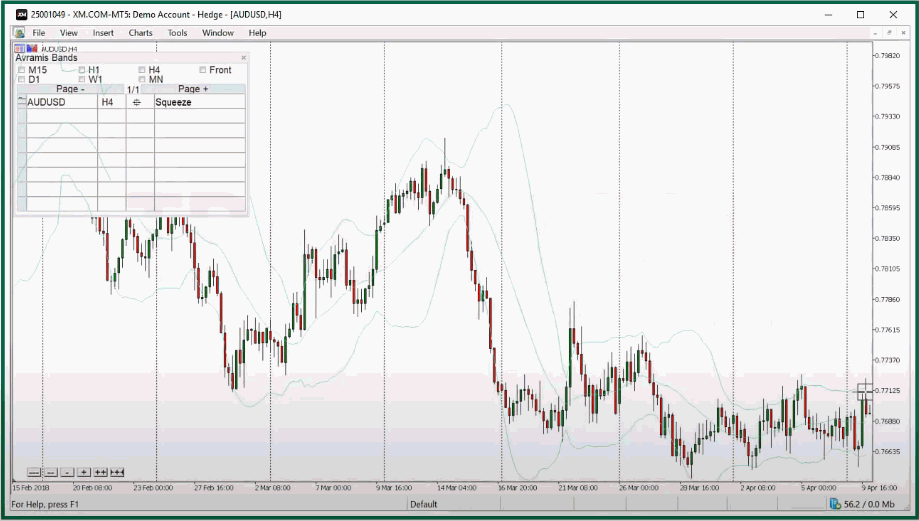
XM Bollinger Bands Indicator可是Helps you assess price fluctuations and potential market trends。With this indicator, you can:
Limit price: when the price is higher or higher than the external band, indicating that the market is overbought or oversold。
Identifying signals in a sideways market: In a sideways or sideways market, prices tend to fluctuate between upper and lower bands。Buying close to the lower band and selling close to the upper band can be a strategy to make a profit in the range market.。
Plot extreme price volatility: the sudden unfolding brought on indicates increased volatility, which may bring the beginning of a strong trend。This is especially useful for trend-following traders looking to profit from large price swings。
Identify entry signals: Traders can quickly browse the various XM tools through the overview table。This saves time and allows opportunities to systematically look for different assets。
ADX and PSAR metrics for XM
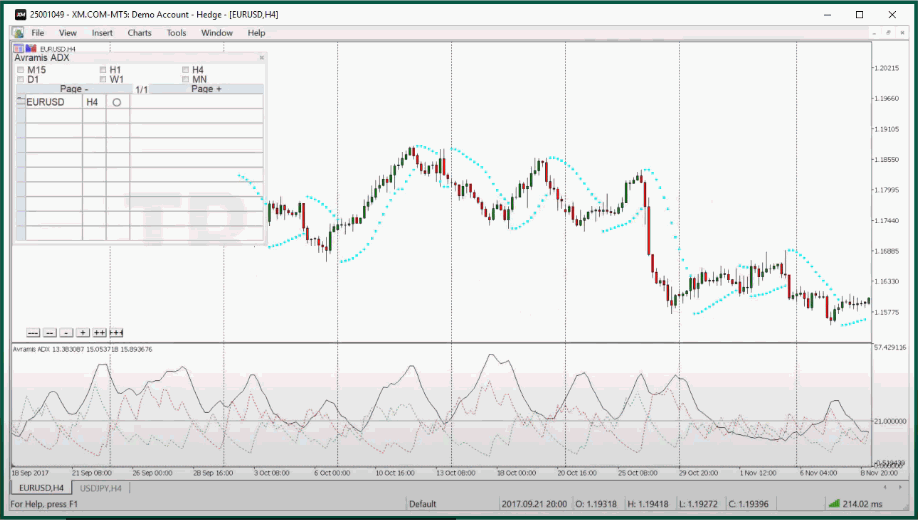
ADX and PSAR indicators can help you determine the strength of the trend and the timing of possible changes in direction。When you use these two indicators at the same time, you can avoid being deceived by misleading signals and decide the direction of investment more wisely。
With this XM metric, you can do the following:
1. Monitoring market volatility trends:The ADX and PSAR indicators work together to detect whether there is a significant rise or fall in the market.。
2. Identify the starting point of new trends:ADX Rising Indicates Upward Trend。PSAR changes position around price hints at possible direction change。When these signals appear at the same time, they represent the beginning of a new trend.。
3. Determine whether the trend has reached an extreme state:If the ADX value is very high, it indicates that the trend is strengthening.。But if it's too high it could mean the trend has gone too far and a turn could occur。With the help of PSAR, you can tell if the trend is at an extreme。
4. View multiple trading instruments at the same time:With this XM indicator you can view each chart one by one to understand the technical outlook of other currency pairs。In fact, you can see the summary in the overview table。
Analyzer Indicators for XM
Analytics metrics help you automatically analyze multiple metrics。You can analyze any tool with moving averages, MACD, relative strength index, etc. at the click of a button。
With this XM indicator you can:
Second speed analysis: automatic analysis function can quickly evaluate multiple indicators, one time。
Real-time weak market direction: This indicator provides a dynamic chart of market direction to help you keep up to date with the latest market trends and changes。
Quickly identify the best trading tools: By evaluating a range of indicators at the same time, you can quickly find well-performing assets。
Advantages of exclusive indicators
The advantages of using XM's exclusive indicators also have disadvantages。
✔ ️ Advantages |
Disadvantages |
You can quickly discover trading signals。 |
The indicator has a higher price compared to the queue free and valid MetaTrader indicator。 |
You can choose to develop a robot or an expert advisor by mixing these indicators。 |
The accuracy of trading signals using this tool varies depending on market conditions。For accurate triggering, consider Chicago's additional filtering strategy。 |
| Few other traders use it, making it unique。 | There is little limited educational content or information on these indicators on the Internet。 |
结论
XM emphasizes that the main advantage of the indicator lies in the design of its user interface, including overview tables and pop-up effective signal notifications。This improves your trading process by making it easier to check multiple assets at the same time。
However, the main characteristics of the indicator determine its accuracy。How well the indicator performs depends on whether the trader is keen to select the right market conditions。For example, trend indicators like Ribbon and River perform best in trending markets, but do not work well in sideways markets。
For beginners, this indicator can be a useful tool。But in my personal opinion, for each indicator invested at least $250 does not seem to be worth it。There are many free MetaTrader indicators available online that work equally well。
If you are curious and don't mind the cost, there is no hindrance to try the XM emphasis indicator。
Disclaimer: The views in this article are from the original Creator and do not represent the views or position of Hawk Insight. The content of the article is for reference, communication and learning only, and does not constitute investment advice. If it involves copyright issues, please contact us for deletion.