Introduction to Investment|How to Calculate Net Worth Per Share?
Value investors use many valuation methods when assessing whether a company's share price is overvalued or undervalued, such as the P / E ratio, the NAV ratio, and others use the book value per share, which is the net value per share, the shareholders' equity per share。

Value investors use many valuation methods when assessing whether a company's share price is overvalued or undervalued, such as the P / E ratio, the NAV ratio, and others use the book value per share, which is the net value per share, the shareholders' equity per share。
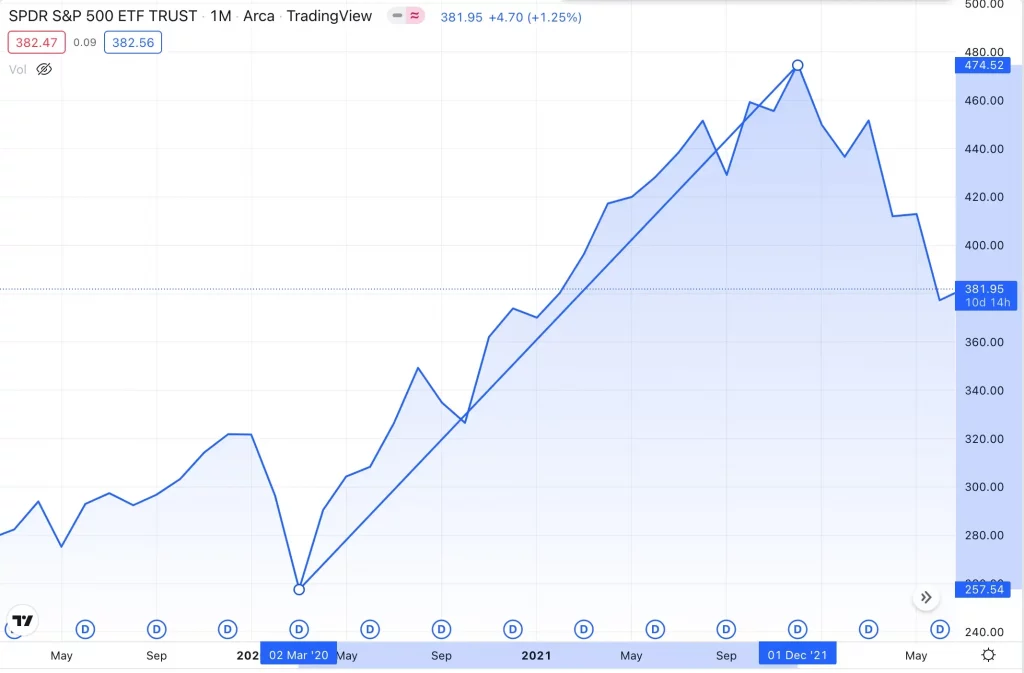
Take, for example, SPY, an ETF that tracks the U.S. S & P 500 (S & P 500), and assume that you are at a low on March 2, 2020, with 257.Buy at $54; and on Dec. 1, 2021 at $474.$52 Sold。Without counting dividends, your buy-low-sell-high move brings you a return of nearly 85%。
Note that the following shares are for demonstration purposes only and are not investment advice。All investments are risky and it is recommended that you do your homework and risk planning before entering the market.。
Everyone knows the truth of buying low and selling high, but under the influence of human, emotional and other factors, the actual operation is not so simple.。
You might think that if you can figure out the true value of the stock (NAV per share), then as long as you buy below the NAV, your investment is invincible and you can't lose it.?
In this article, let's take a look at this strategy and see if it's really a sure bet.?You'll learn about the definition of NAV per share, the formula for calculating it, the relationship between the NAV ratio and NAV per share, the relationship between NAV per share and earnings per share, and how NAV per share is queried.
What is net worth per share (NAVPS)?
Net Asset Value per Share (NAVPS)。Net value per share refers to the remaining portion of a company's total assets after deducting total liabilities.。
In other words, it is possible to estimate the value of the company that shareholders actually own, which includes the value of the company's own capital and the money it makes。
At the same time, NAV per share can be applied mainly to investment products, including equities, mutual funds, exchange-traded funds (ETFs) or closed-end funds.。
Formula for calculating net value per share (NAVPS)
The formula for calculating net worth per share is actually very simple, as follows.
Net value per share = (total assets - total liabilities) / number of shares issued
For example, Company X has total assets of $100 million and total liabilities of $40 million, while the total number of shares outstanding is 2.5 million shares.。
Company X NAV per share = ($100 million - $40 million) / 2.5 million shares = $24
-
NAV per share can also help you calculate the PB Ratio
When you calculate the NAV per share of Company X, you will have to compare it with the share price, after all, you can't say, "Company X's share price is now xx yuan higher / lower than the NAV per share."。
As a result, the Price-Book Ratio (PB, P / B, PBR, etc.) can come in handy, making it easy to use multiples to see how the share price compares to net worth。
The formula for calculating the net share price ratio (PB Ratio).
Share price to net worth ratio = share price / net worth per share
Continuing to apply back to Company X's example, after arriving at a net worth of $24 per share, assume that the stock price is at $12, $24, and $48 per share.。
- Scenario 1: $12 to NAV = $12 / $24 = 0.5 times
- Scenario 2: NAV ratio of $24 = $24 / $24 = 1 times
- Scenario 3: NAV ratio of $48 = $48 / $24 = 2x
-
What can the price-to-net ratio tell you??
So the question is, when you see Company X's share price NAV ratio as low as 1 times, does that mean you have an opportunity to invest in it??
First of all, you need to understand the significance of the NAV ratio result.。
When the NAV ratio is 0.At 5 times, it means that the investor can buy the company's stock at a 50% discount, and if it is 2 times, it means that the investor is willing to buy the stock at 2 times the price.。
Therefore, when you use a discount to buy a particular stock, it means that the stock price has more potential to rush higher in the future, while buying at a premium means that there is more room for potential downside。
However, you can never just use the NAV ratio as your only reference for buying shares, after all, the company's NAV is not equated with future performance; moreover, in some cases the company's business is performing well, so the NAV ratio is naturally higher。
So if you know that the company is likely to perform better in the future, but hesitate because the NAV ratio is too high, then as the company grows and its assets rise, the further surge in the stock price will probably make you regret it.。
So remember, the NAV ratio must never be the only indicator you refer to。
Practical application examples of net worth per share (NAVPS)
Let's take the electric car company Tesla (Tesla), as of the end of March 2022 earnings as an example.。
Note that the following shares are for demonstration purposes only and are not investment advice。All investments are risky and it is recommended that you do your homework and risk planning before entering the market.。
You can find Tesla's total assets and liabilities in the Balance Sheet; you can find the number of shares outstanding on the front page of the financial report.
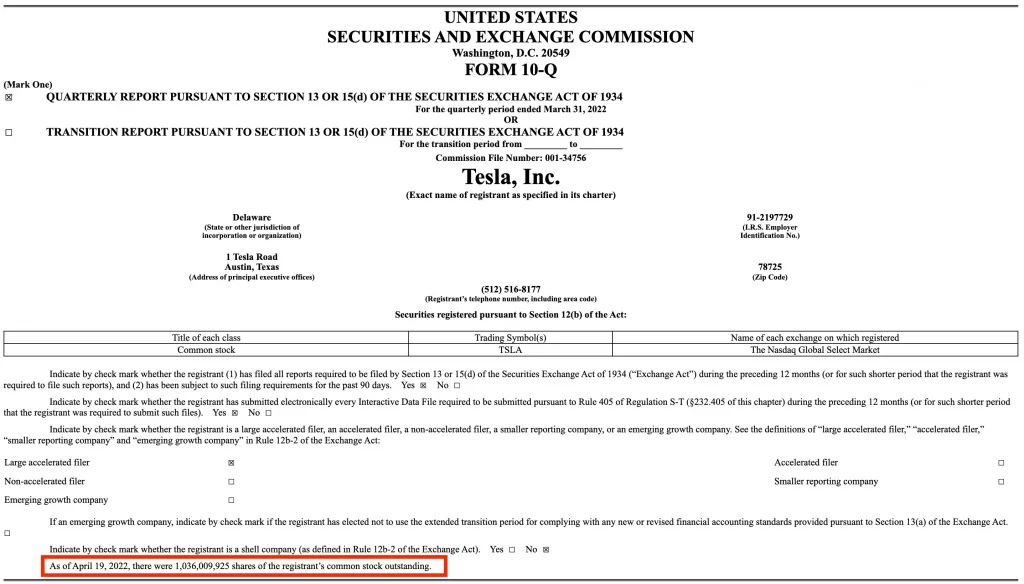
According to the chart above, the total value of Tesla assets is 660.$3.8 billion, with total liabilities of 306.3.2 billion, and on April 19, there were 10.3.6 billion shares outstanding。
Thus, we can conclude that the Tesla NAV per share is 34.17美元。
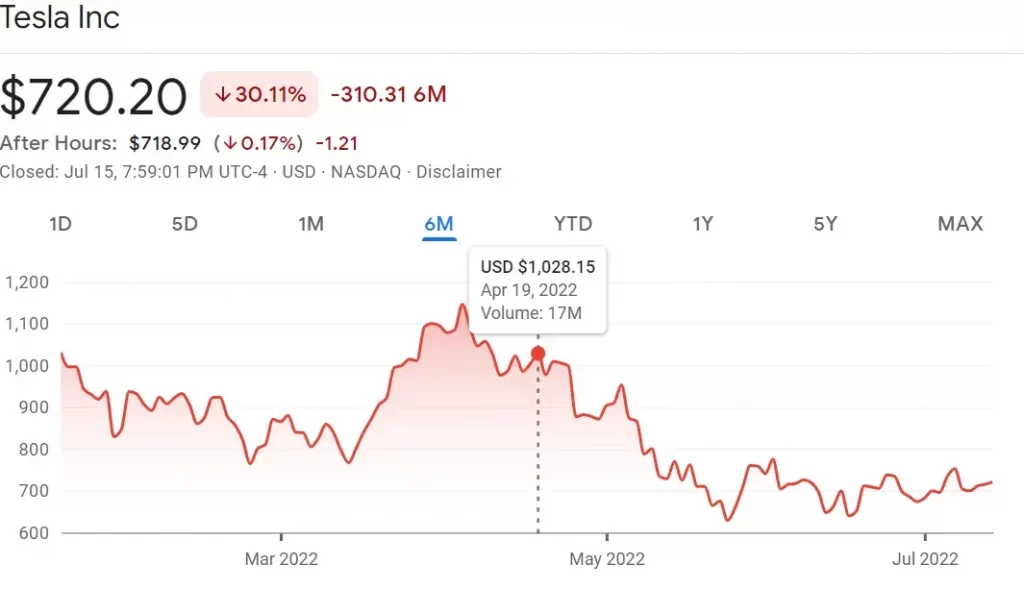
Based on its closing price on April 19, 2022, Tesla closed at 1028 per share..15美元。
From this, we can calculate the Tesla share price to net worth ratio of 30.09 times。
Net Worth Per Share vs Earnings Per Share: Which Is Better?
There are limitations when using the NAV per share metric, as it can only calculate whether the share price is too low or too high for the company's profitability to be measured。
So at this point you need to look at the metric that can measure the company's earnings, which is Earnings per Share (EPS).。
Nevertheless, the P / E indicator will not work when the company's earnings are losing money or fluctuating considerably, and then you can use the NAV ratio instead。
How to query net value per share?
At the same time, we can directly check the net value per share of listed companies through the existing investment information website.。
The choice of Taiwan stocks, there are earnings dog, play stock network and HiStock, U.S. stocks, you can choose the earnings dog.。
SUMMARY
Through the author's explanation, I believe you already know: the net value of the stock price than the discount does not mean that the company's stock has room to rise in the future, and buying discounted stocks does not mean that you have a clear eye.。
Each indicator has its advantages and disadvantages and limitations, so when using NAV per share, it is more important to use it with other indicators。
·Original
Disclaimer: The views in this article are from the original Creator and do not represent the views or position of Hawk Insight. The content of the article is for reference, communication and learning only, and does not constitute investment advice. If it involves copyright issues, please contact us for deletion.