Upside Tasuki Gap Candlestick Pattern - What Is And How To Trade
Learn all about the Upside Tasuki Gap candlestick pattern.What is, how to trade, and all the best trading strategies.
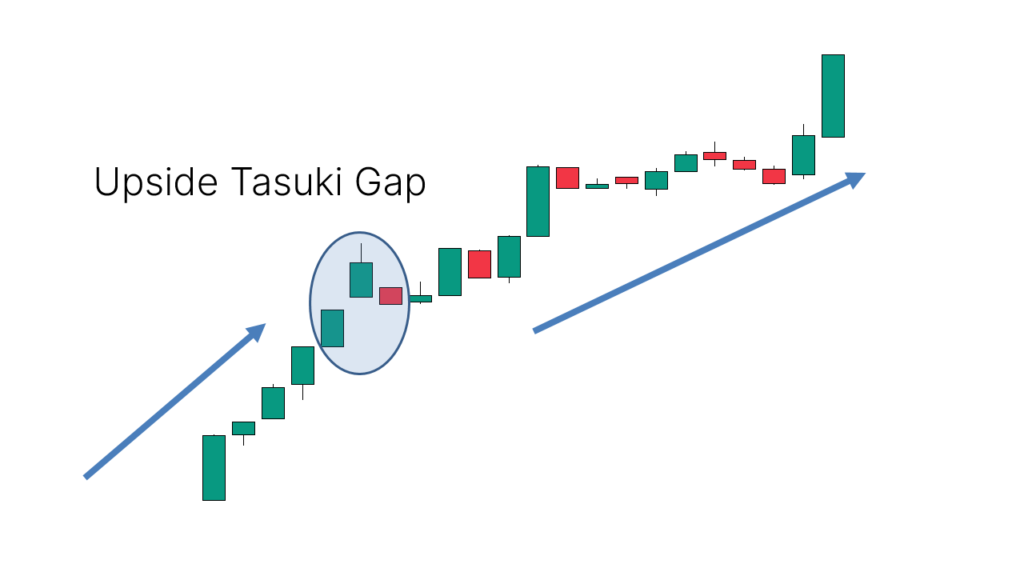
The "Upside Tasuki Gap" is a classic Japanese candlestick pattern that represents a bullish continuation. Typically appearing during a pause following a price increase, it indicates market rejection of lower prices. As the mirror image of the "Downside Tasuki Gap," it suggests a potential continuation of the upward trend after the pattern forms.
How to Identify the Upside Tasuki Gap Candlestick Pattern
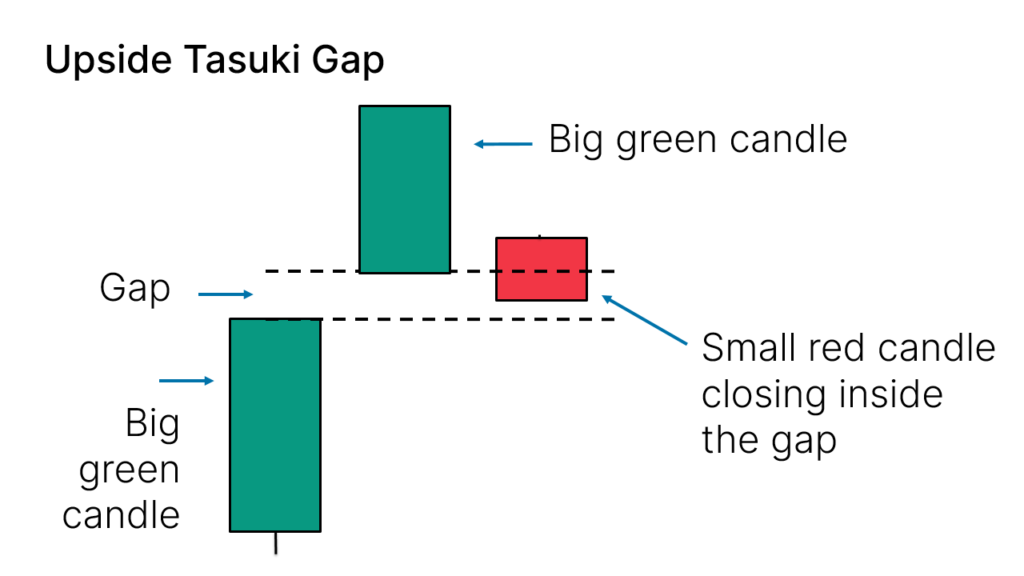
The "Upside Tasuki Gap" pattern consists of three candles:
- First Two Candles: Two consecutive large bullish candles (upward candles) with a gap between them.
- Third Candle: A small bearish candle (downward candle) that closes within the gap formed by the first two candles.
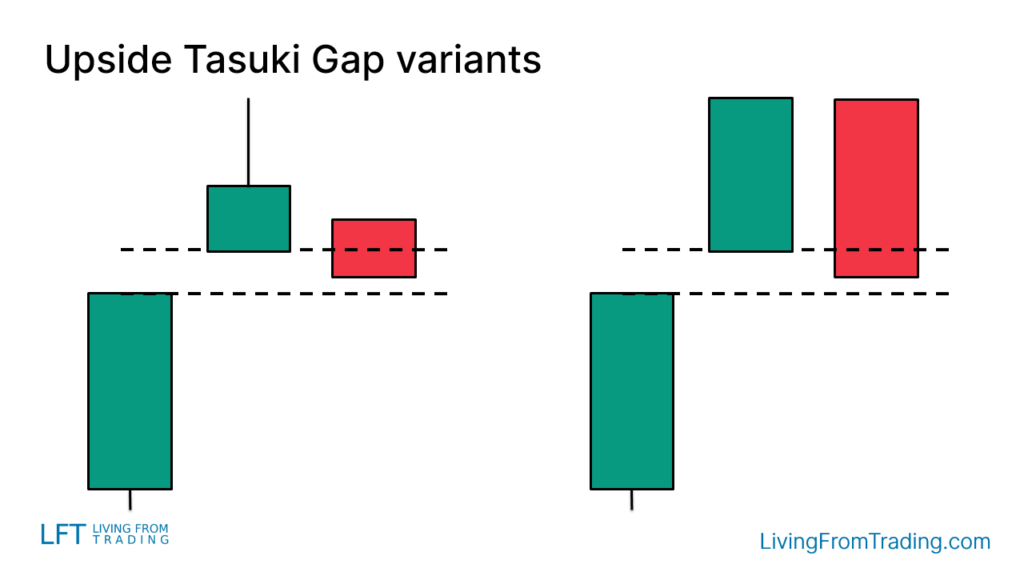
Variants of the Upside Tasuki Gap Candlestick Pattern
In practice, the "Upside Tasuki Gap" pattern may appear with variations:
- Bearish Candle Wicks: The bearish candle may have a small upper wick.
- Gap Variations: There may be a gap between the open of the last candle and the close of the second candle.
How to Trade
To trade the "Upside Tasuki Gap" pattern effectively, it is not enough to identify the pattern alone. Consider the pattern’s context:
- Confirm the Uptrend: Ensure that an uptrend is in place before the appearance of the "Upside Tasuki Gap."
- Trade Trigger: Enter a buy position when the high of the last candle is broken.
- Set Stop-Loss: Place a stop-loss on the opposite side of the pattern to protect against potential market reversals.
Trading Strategies
Strategy 1: Pullbacks on Naked Charts
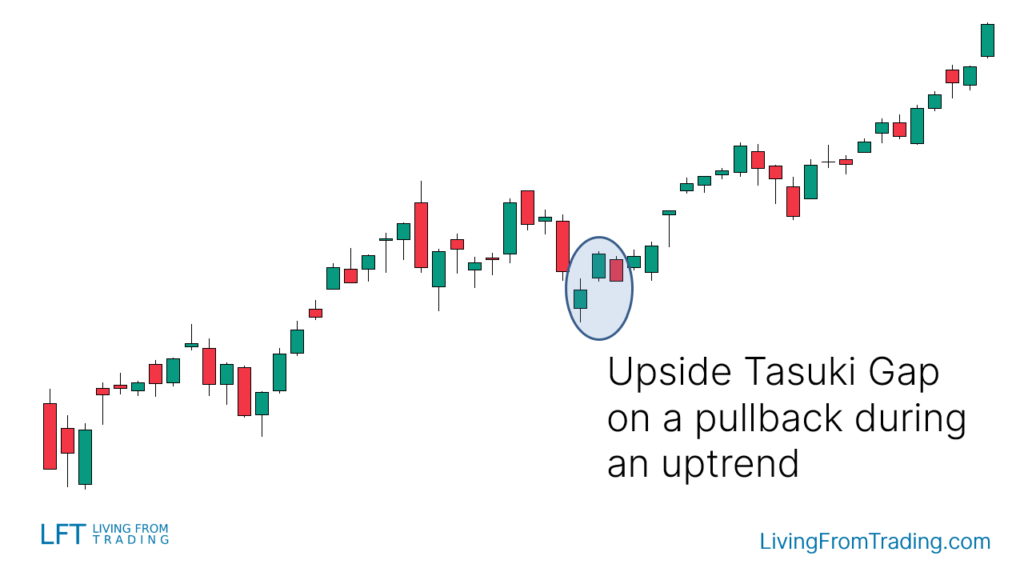
As a bullish continuation pattern, the "Upside Tasuki Gap" is a strong signal to watch during an uptrend. The key is to wait for a pullback and then catch the new leg of the uptrend.
Detailed Steps:
- Identify the Trend: First, confirm that the market is in an uptrend. This can be done by observing long-term and short-term trend lines or using trend indicators such as moving averages.
- Monitor for Pullbacks: After confirming the uptrend, wait for a pullback, which is typically a short-term decline or consolidation.
- Spot the Pattern: Look for the "Upside Tasuki Gap" formation during the pullback. This often signals the end of the pullback and the start of a new upward move.
- Entry Point: Enter a long position when the high of the last candlestick in the "Upside Tasuki Gap" is broken.
- Set Stop-Loss: Place a stop-loss below the pattern formation to protect against unexpected market fluctuations.
Strategy 2: Trading with Resistance Levels
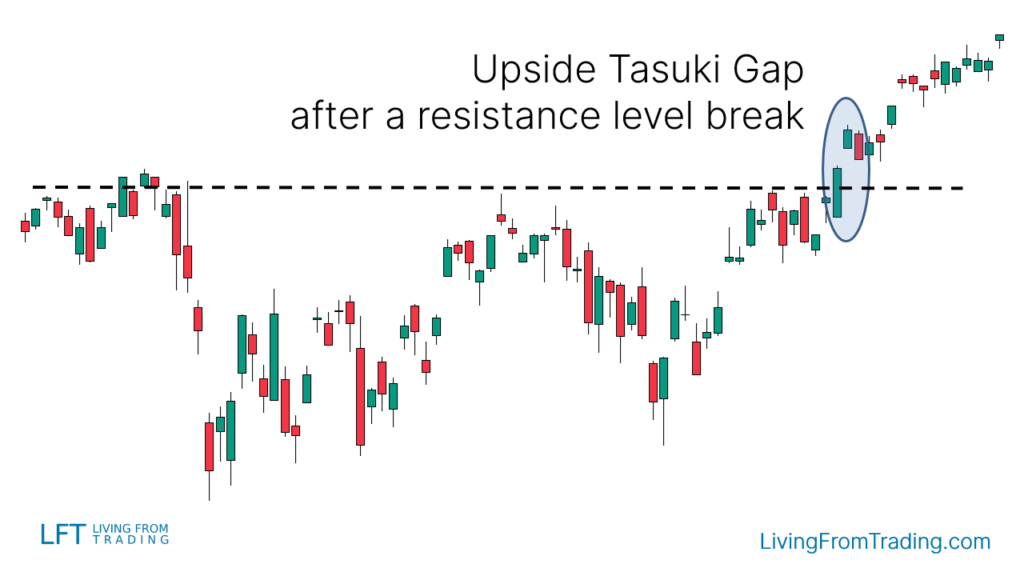
Use resistance levels to confirm the validity of the "Upside Tasuki Gap" and find the right entry point.
Detailed Steps:
- Identify Resistance Levels: Mark important resistance levels on the chart, typically where the price has previously encountered selling pressure or significant technical levels.
- Observe Breakouts: Wait for the price to move up, break the resistance level, and then retrace.
- Find the Pattern: Look for the "Upside Tasuki Gap" at the resistance level that has been broken and retested.
- Entry Point: Go long when the price breaks above the high of the last candlestick in the "Upside Tasuki Gap."
- Set Stop-Loss: Place a stop-loss below the new support level formed by the broken resistance.
Strategy 3: Trading with Moving Averages
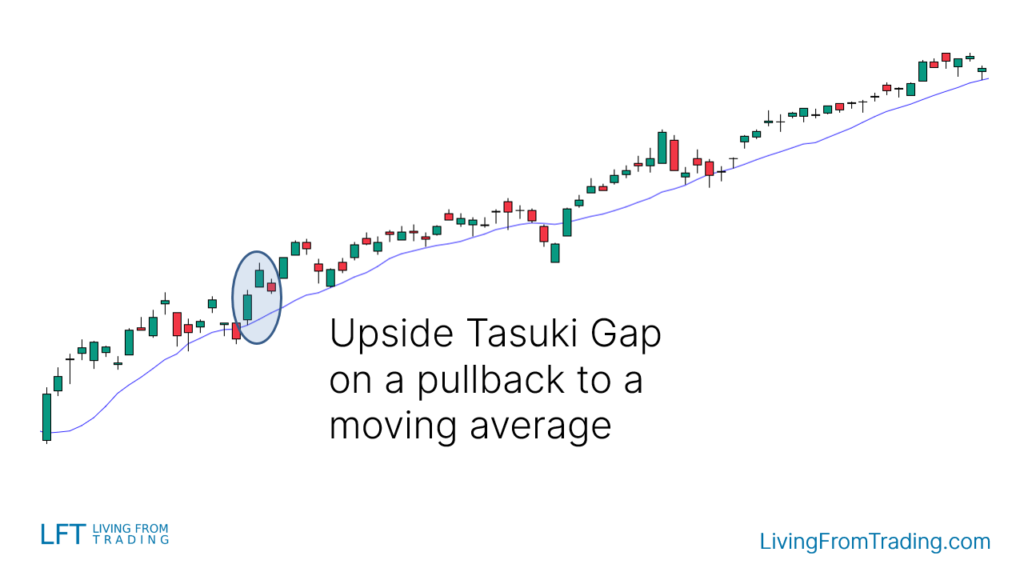
Utilize moving averages as a trend confirmation tool and trade pullbacks to the moving average during an uptrend.
Detailed Steps:
- Select Moving Averages: Choose an appropriate moving average (e.g., 20-day or 50-day moving average) based on the market trend.
- Monitor the Trend: Ensure that the price is above the moving average, indicating an uptrend.
- Watch for Pullbacks: Wait for the price to pull back to the moving average.
- Spot the Pattern: Look for the "Upside Tasuki Gap" near the moving average.
- Entry Point: Enter a long position when the price breaks above the high of the last candlestick in the "Upside Tasuki Gap."
- Set Stop-Loss: Place a stop-loss below the moving average or the pattern formation to minimize risk.
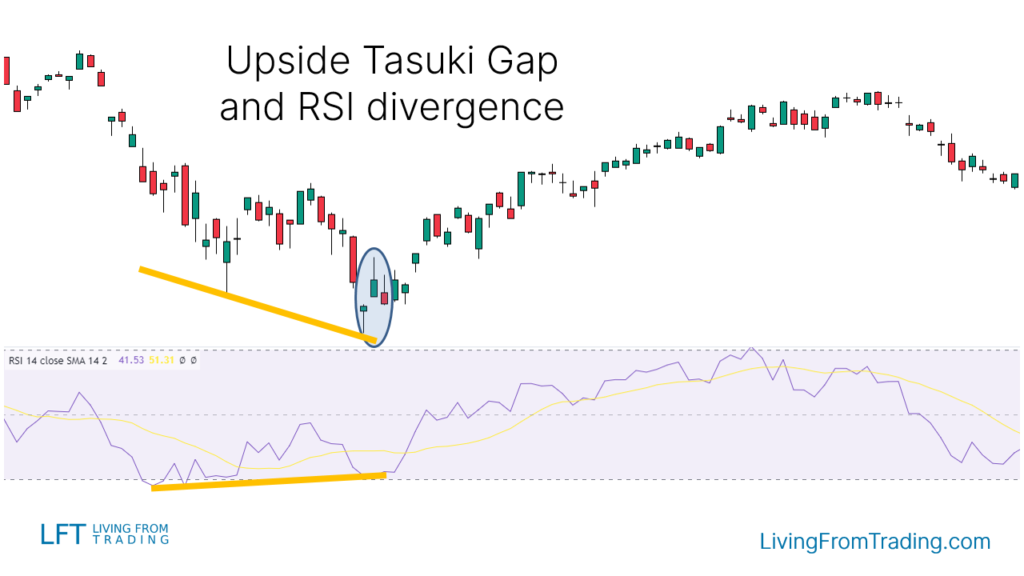
Strategy 4: Trading with RSI Divergences
Combine RSI divergences with the "Upside Tasuki Gap" pattern to enhance accuracy and success rate.
Detailed Steps:
- Monitor RSI: Identify RSI divergences, where price makes lower lows while RSI makes higher lows, indicating a potential reversal.
- Confirm Divergence: When you observe RSI making higher lows while the price makes lower lows, this indicates a divergence.
- Find the Pattern: Look for the "Upside Tasuki Gap" at a lower price low that aligns with the RSI higher low.
- Entry Point: Go long when the price breaks above the high of the last candlestick in the "Upside Tasuki Gap."
- Set Stop-Loss: Place a stop-loss below the pattern formation to protect against market reversals.
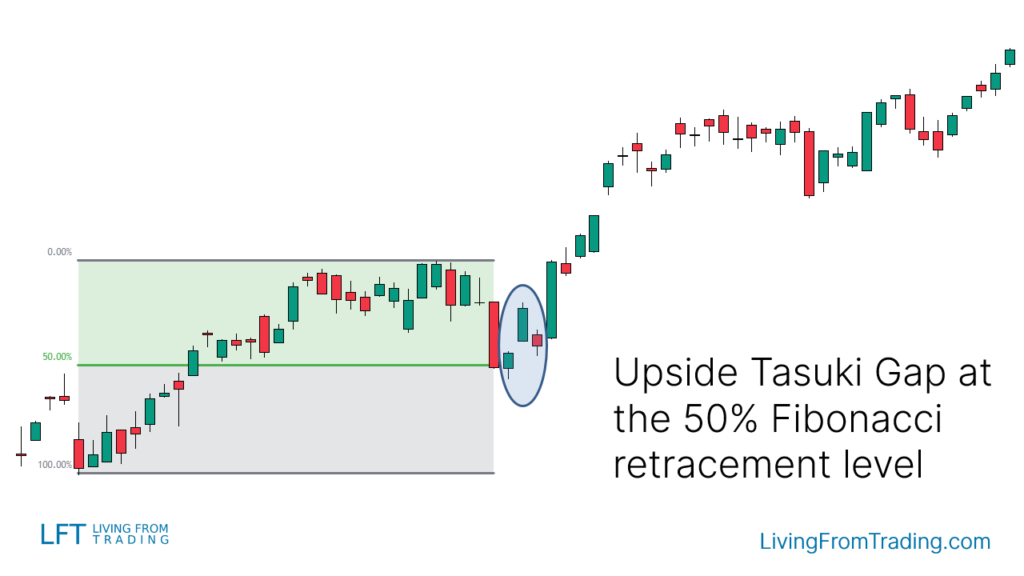
Strategy 5: Trading with Fibonacci Retracement
Use the Fibonacci retracement tool to confirm the "Upside Tasuki Gap" pattern and find the optimal entry point.
Detailed Steps:
- Draw Fibonacci Levels: Apply the Fibonacci retracement tool from the low to the high of the recent move.
- Watch for Retracements: Wait for the price to retrace to key Fibonacci levels (e.g., 38.2% or 61.8%).
- Spot the Pattern: Look for the "Upside Tasuki Gap" at the Fibonacci level where the price has retraced.
- Entry Point: Enter a long position when the price breaks above the high of the last candlestick in the "Upside Tasuki Gap."
- Set Stop-Loss: Place a stop-loss below the Fibonacci level to manage risk.
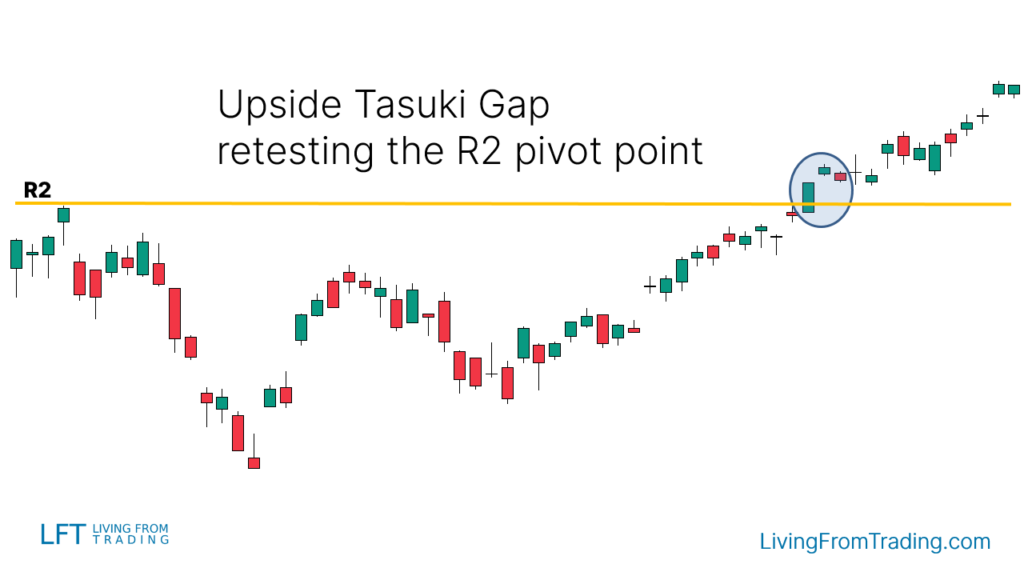
Strategy 6: Trading with Pivot Points
Utilize Pivot Points as automated support and resistance levels to trade the "Upside Tasuki Gap" pattern.
Detailed Steps:
- Apply Pivot Points: Add the Pivot Points indicator to your chart to identify key support and resistance levels.
- Monitor Price Action: In an uptrend, watch for price movement to a Pivot Point level and a subsequent breakout.
- Find the Pattern: Look for the "Upside Tasuki Gap" at the Pivot Point level that has been broken and retested.
- Entry Point: Go long when the price breaks above the high of the last candlestick in the "Upside Tasuki Gap."
- Set Stop-Loss: Place a stop-loss below the Pivot Point level to protect against potential reversals.
Summary
The "Upside Tasuki Gap" is a bullish continuation pattern that suggests the price may continue to rise within an uptrend. To enhance trading accuracy, it is beneficial to combine the pattern with pullbacks, moving averages, and other technical indicators. With a success rate of 57%, it is a valuable tool for traders.
Disclaimer: The views in this article are from the original Creator and do not represent the views or position of Hawk Insight. The content of the article is for reference, communication and learning only, and does not constitute investment advice. If it involves copyright issues, please contact us for deletion.