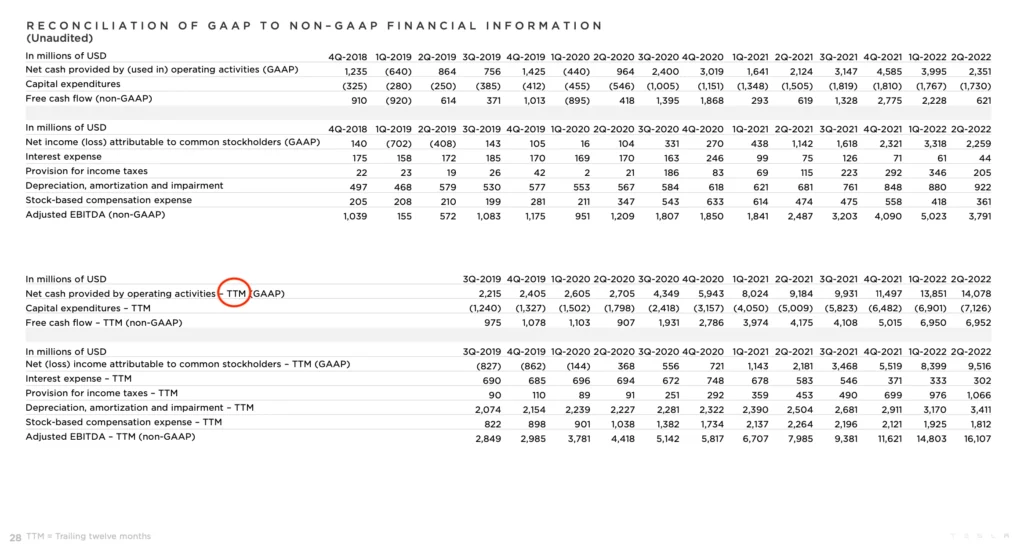
What is TTM??What is the difference with the fixed fiscal year data??
This article will take you to understand what TTM is, how TTM is calculated, share common TTM financial data, and the difference between using TTM data and fixed fiscal year data.。

When investors study the performance reports of listed companies, they often see TTM next to some of the financial indicators.
What is TTM??What is the difference with the fixed fiscal year data??Is TTM data important??The author of this article will give you a comprehensive answer。

What is TTM??
TTM's full English name is Trailing Twelve Months, which in financial terms means the past 12 months or nearly 4 quarters.。
TTM can be applied to the company's 3 major accounting statements: balance sheet, profit and loss statement and cash flow statement.。
In the financial statements, if TTM's financial analysis indicator is noted, it means that the data obtained from this indicator are calculated from the company's data for the last four quarters.。
Readers may question that the company's annual report already contains the company's four-quarter fiscal data。So what is the difference between TTM data and annual report data?
In fact, the four quarters in the annual report refer to the first to fourth quarters of a given fiscal year;。Here is a simple example to illustrate:
| Annual Report | 2021Q1 | 2021Q2 | 2021Q3 | 2021Q4 |
| TTM | 2021Q4 | 2022Q1 | 2022Q2 | 2022Q3 |
Simply put, TTM does not have any specifications for which quarter the data comes from, as long as it is the last four quarters.。Therefore, TTM is very flexible in processing financial data.。
▍ Significance of TTM Appearance
The data processed by TTM balances the company's differences due to seasonal problems, thus solving some of the problems of data lag, such as the company's off-budget expenditures or global economic problems, so that investors can obtain more objective financial data.。
TTM data is more reflective of the company's current reality than just referencing data for a particular year or quarter.。However, not all financial data is suitable for processing using TTM, which will be explained in more depth at the end of the article。
▍ TTM calculation formula
Here is the formula for TTM:
TTM = latest quarter + last quarter + last two quarters + last three quarters
Attached below is the revenue for the last four quarters of TSMC and the Malaysian Stock Exchange, i.e., revenue TTM, to demonstrate how TTM is calculated.。
-
TSMC Revenue TTM Calculation

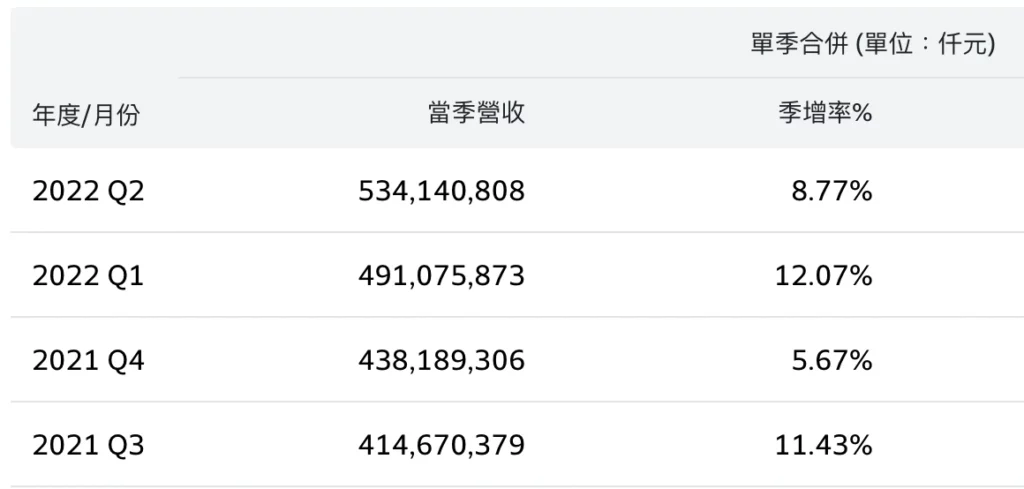
TSMC, Listed on Taiwan Exchange (2330.TW), its income TTM is calculated in the same way as above.。
As can be seen from the figure, TSMC's revenue TTM = 534,140,808 thousand yuan + 491,075,873 thousand yuan + 438,189,306 thousand yuan + 414,670,379 thousand yuan = 1,878,076,366 thousand yuan。
In other words, TSMC's total revenue from the third quarter of 2021 to the second quarter of 2022 (a total of four quarters) is $1,878,076,366,000.。
-
Malaysia Stock Exchange Revenue TTM Calculation
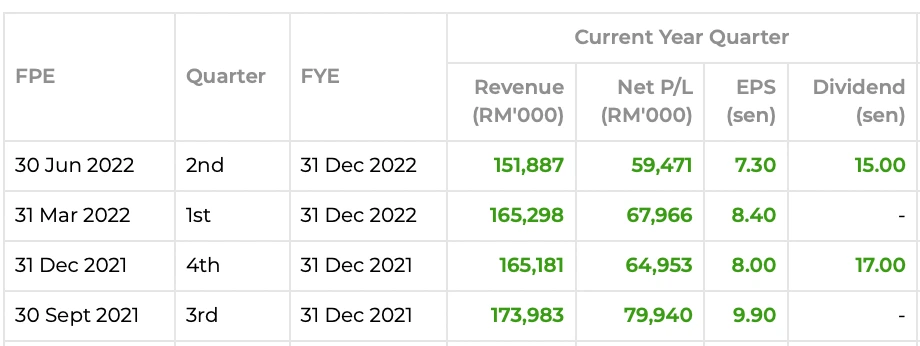
The Malaysian Stock Exchange (BURSA, 1818).KL) income TTM can be calculated according to the above formula:

The second quarter of fiscal 2022 is the company's latest financial performance, as can be seen from the chart, revenue TTM = 151,887m + 165,298m + 165,181m + 173,983m = (RM) 656,349m.

In addition, using the full data for fiscal year 2021, we would conclude that the company's revenue is RM 767,535m.。
According to data from the Bursa Malaysia earnings report, the company's sharp drop in revenue in the latest quarter was mainly due to lower investor trading volumes。In recent months, the issue of interest rate hikes and the various environmental factors have dampened investor sentiment for trading, and as a result, the income of the Malaysian Stock Exchange has been affected.。
As a trading reference for short-term investors, using data from the previous fiscal year to analyze the company will more or less eliminate the impact of the current environment, and these uncontrolled factors will not improve in the short term, ignoring the real situation of the company today.。
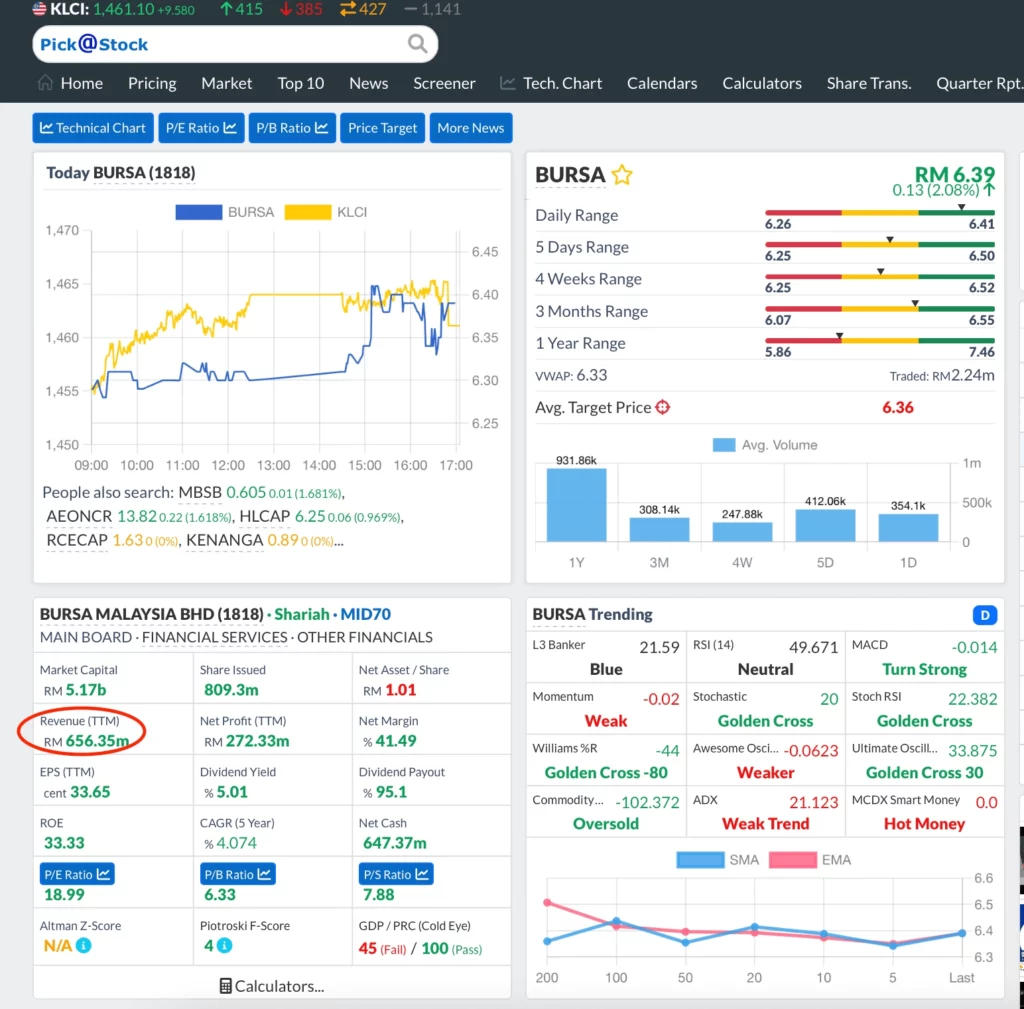
However, you can also find TTM data on a stock analysis website or software without having to calculate it yourself。

- TTM revenue from the Malaysian Stock Exchange (Image source: [emailprotected])
▍ Some of the financial indicators you also need to pay attention to TTM
When evaluating a company, the first priority is to use the latest data available to us。If we use only audited financial statements such as the income statement, these lagging data do not reflect the company's current situation like TTM data.
-
TTM Price / Earning Ratio
TTM P / E formula:
TTM P / E Ratio (TTM Price / Earning Ratio) = Share Price / EPS EPS (TTM)
Price / Earnings ratio (P / E ratio) is the ratio of the market price per share of a stock to earnings per share, and is an indicator that best reflects the relationship between an investor's input and earnings.。
The TTM P / E ratio, also known as the rolling P / E ratio, is closer to the company's current most realistic valuation than the static P / E ratio, as the TTM P / E ratio uses the company's most recent four quarters of data.。
The TTM P / E ratio provides investors with relatively objective data when the company's performance changes significantly due to seasonal factors。
-
TTM Earnings per Share
TTM EPS Formula:
TTM earnings per share (EPS) = net profit for the past 12 months / total number of shares issued and sold
Earnings per share (EPS) is one of the most important measures of stock value, and the ratio reflects the after-tax profit created behind each share.。Of course, the higher the ratio, the higher the profits created.。
Since TTM earnings per share is judged using the latest 12-month fiscal performance, assuming the market has entered a downturn in recent times, this TTM data will more objectively reflect the company's true strength as it experiences distress。The TTM data provides investors with a more real-time reference than simply referring to good fiscal performance stuck in previous markets.。
▍ Can I use TTM to calculate dividends??
Not recommended。Although the timing of the company's dividend payments will not change significantly in general, if a special dividend is paid, there is a certain inapplicability for the reference comparability of the data。
▍ Summary
TTM data provides investors with another way to interpret financial results, and while TTM does not apply to all financial metrics, it still provides some help in determining the reference of financial performance。
·Original
Disclaimer: The views in this article are from the original Creator and do not represent the views or position of Hawk Insight. The content of the article is for reference, communication and learning only, and does not constitute investment advice. If it involves copyright issues, please contact us for deletion.