Uncovering Moomoo trading platform: 10 hidden features to help you accurately select stocks and easily invest in global markets
This article shares 10 hidden functions of the Moomoo trading platform owned by Futu Securities (Singapore), and how to use these functions to understand a stock and find a target worth investing in!

Almost all investors involved in U.S. stock investment are familiar with the Moomoo trading platform launched by Futu Securities (Singapore).Moomoo has the characteristics of trading Hong Kong, the United States, New Zealand and China A-share markets with one account, and has attracted much attention because of this advantage.The platform integrates all functions such as chart data, news information, and social interactive platforms for individual stocks, and provides bilingual interfaces in Chinese and English, making it easier for investors to participate in overseas market transactions.
However, when using the Moomoo platform, many investors are often limited to basic order transactions or browsing the company's financial data and latest developments.Many other practical features and details within the platform are rarely touched upon, and some are even unknown.This article aims to share with you the 10 hidden features of the Moomoo trading platform and guide you on how to use these features to gain an in-depth understanding of stocks and find worthy investments.
The article mainly focuses on some hidden functions that individuals commonly use.If readers discover other features of the Moomoo platform or encounter problems while using them, they are welcome to share and discuss them with us in the message area.By delving into various functions of the Moomoo platform, investors can gain a more comprehensive and in-depth understanding of the market and better formulate investment strategies.
Futu Securities (Singapore) and trading platform Moomoo
Futu Securities (Singapore) is a subsidiary of Futu Holdings (NASDAQ: FUTU), a company listed on NASDAQ in the United States. It provides trading services for stocks and other financial derivatives through the trading platform Moomoo.Futu Securities (Singapore) is a Singapore licensed securities firm regulated by the Monetary Authority of Singapore (MAS).
Moomoo supports desktop and mobile App trading systems, and has up to 31 operating interface modes that can operate across screens.Whether you are a novice, a long-term investor or a short-term trader, whether you belong to the fundamental, technical, news or financial analysis genre, you can find very comprehensive data in Moomoo.
The following will show you the basic operating interface of the Moomoo trading platform, which is mainly based on mobile apps and traditional Chinese.
Moomoo basic operating interface description
Log in to the Moomoo trading platform and the latest quotes for individual stocks will be displayed on the home page.Investors can adjust their own stocks, data display habits, ranking of individual stocks, etc. as needed.Moomoo's interface design is simple and clear, and functions such as individual stock information, order trading, transaction inquiry, investment profit and loss, asset status, and deposit operations can be easily realized. It is also smooth when used, bringing a better experience for investors.
If you are not familiar with the Chinese interface, you can adjust the language settings first.The operation method is to click the "My" icon in the lower right corner> theˇ icon in the upper right corner to enter "Settings"> General> Multiple Languages> Select English. After saving, you can switch languages.
Personal information, quote settings, transaction settings, information settings, etc. can be adjusted in "Settings".
The moomoo interface description is as follows:
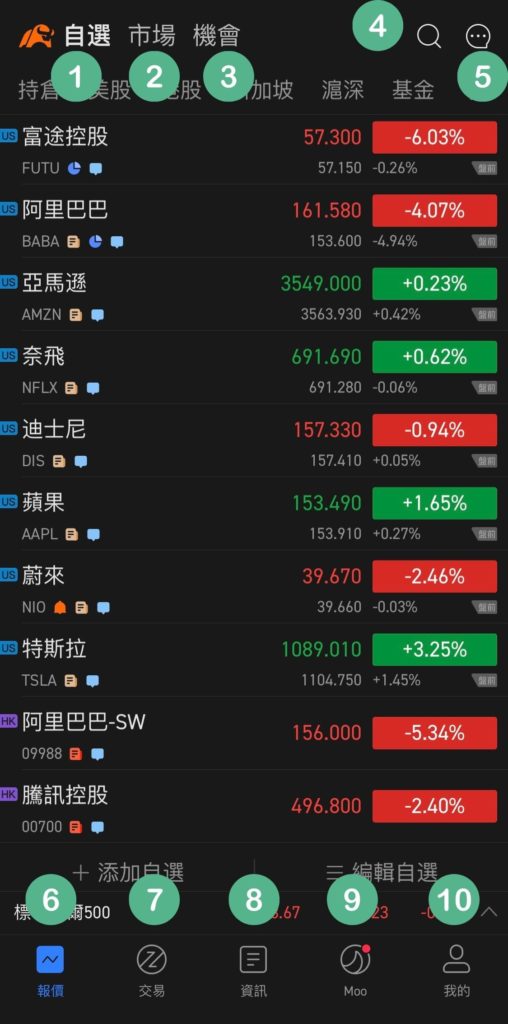
| Code | Function | Description |
| 1 | self-service | Establish a list of stocks to follow, similar to a stock picking pocket list, and switch to different securities markets and funds |
| 2 | market | The trend status of various markets and sectors will be displayed here |
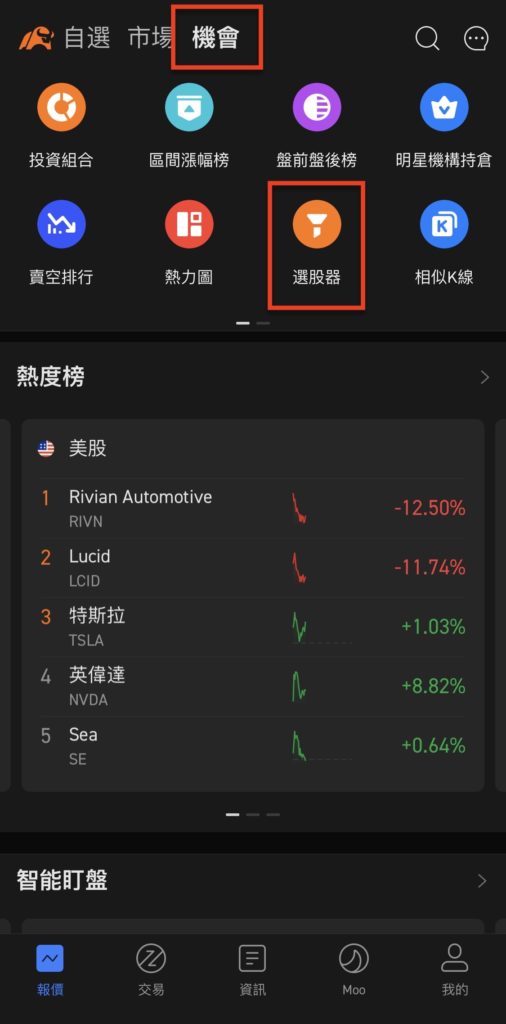
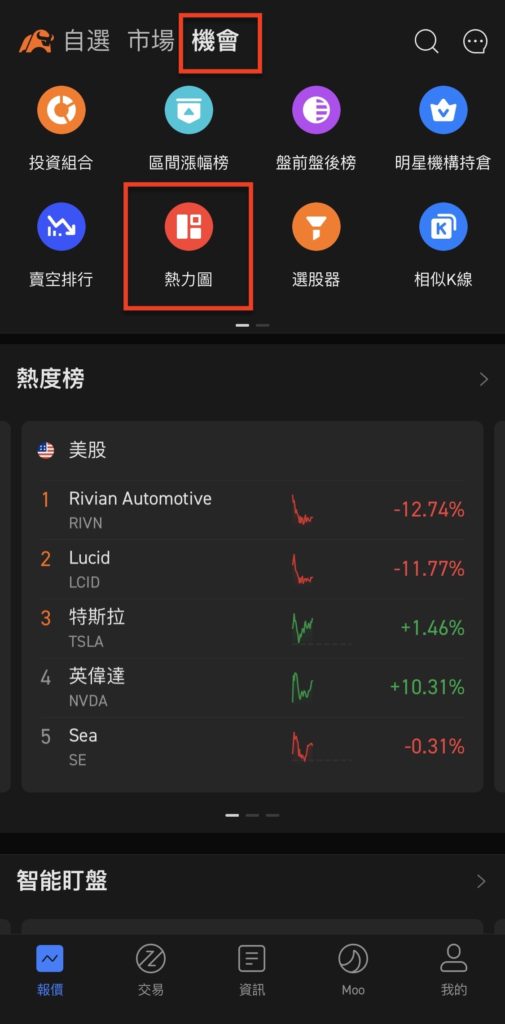
| 3 | opportunity | Display the latest investment opportunities, such as stock market heat lists, heat maps, star institutional positions, etc. You can also use a stock picker to screen stocks that match your investment preferences |
| 4 | search function | Enter the code to find stocks, indexes, cryptocurrencies, etc.; enter keywords to find relevant user accounts, news information, user-shared investment portfolios, corporate announcements, user-shared posts and experience analysis, help, Moomoo classroom, etc., and can also connect to stock picker |
| 5 | message | View order transactions, system messages, chat room content, etc., or connect to Moomoo online customer service |
| 6 | quotation | Quotation information for stocks, indices, cryptocurrencies, etc. is displayed here |
| 7 | transaction | Place orders and trade, check asset status, and connect to the new share subscription, deposit, currency exchange function windows, and Futu Elephant Fortune's fund window |
| 8 | information | View real-time hot stock market information, Moomoo features, news videos, financial calendar, IPO news, etc. |
| 9 | Moo | Moomoo social activity community that can communicate with users around the world and connect to Moomoo classrooms |
| 10 | my | View personal information, earn points for completing tasks, connect to demo trading, Moomoo Help Center and online customer service, and view all trade-related functions such as deposit and withdrawal, stock transfer, account statement, etc. |
Next, we will enter the descriptions of Moomoo's 10 hidden functions.
Real-time market data: U.S. stocks Level 2, China A shares, Singapore shares Level 1
As long as you complete registration and account opening in Moomoo, you can check real-time market data for free, including:
- Second-level real-time quotes in the US market
- Singapore Market Level 1 Market
- China's A-share primary market
The second-level real-time quotation will display more detailed and complete quotation information. Investors can grasp the latest price dynamics of individual stocks and find the most suitable trading opportunities through more market trading information.
Most brokers need to pay an extra fee to subscribe to Level 2 quotes, while Moomoo provides Level 2 quotes for U.S. stocks for free.
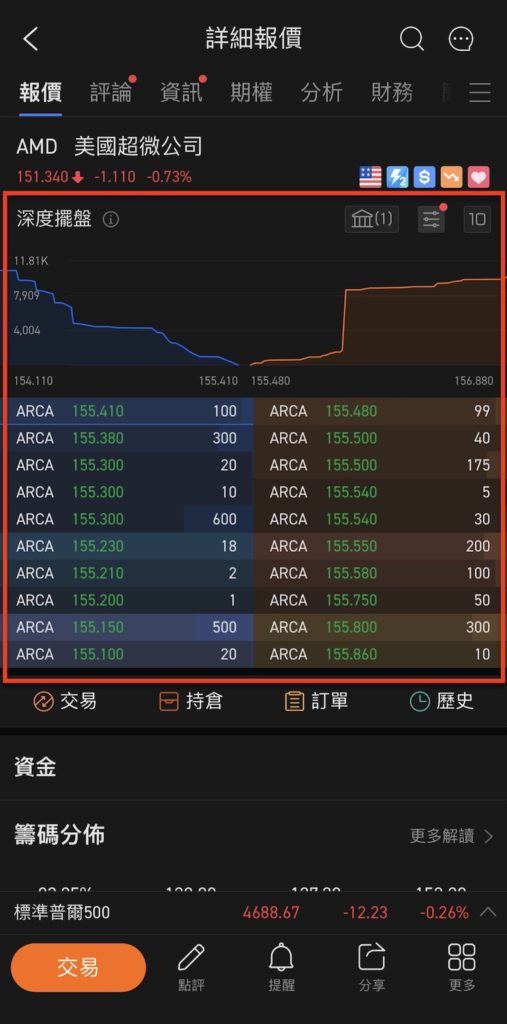
Using skills
Search for any stock, click to view the detailed page of the stock. Under the stock price trend chart on the "Quotation" page, you will see the second-level real-time data quotation.
In the "Deep Placement" column, we can see up to 40 buying and selling quotes.Currently, it mainly displays the order market of NYSE ArcaBook, the second largest electronic stock exchange in the United States.If you want to view more order quotes and prices on NASDAQ TotalView, NYSE OpenBook or other exchanges, you can order at the Moomoo Quotes Mall (My> Quotes Mall).
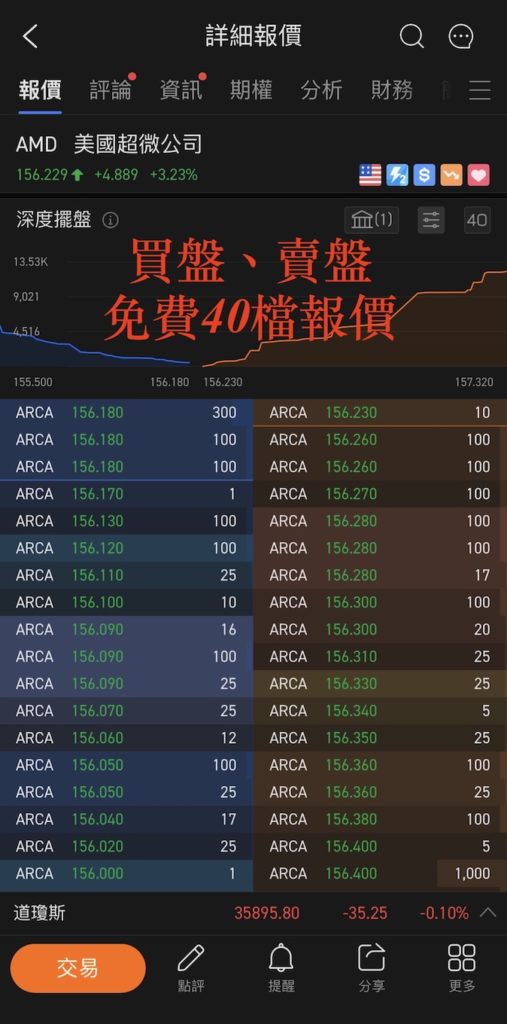
The blue area on the left is Bid, and the orange area on the right is Ask. Each line is a purchase order, representing a buy and sell order waiting to be completed. The data includes the market maker code, bid price and number of shares.
Buying and selling orders bid by investors will appear in buying or selling orders as long as they cannot be completed immediately.Once implemented, it disappears.
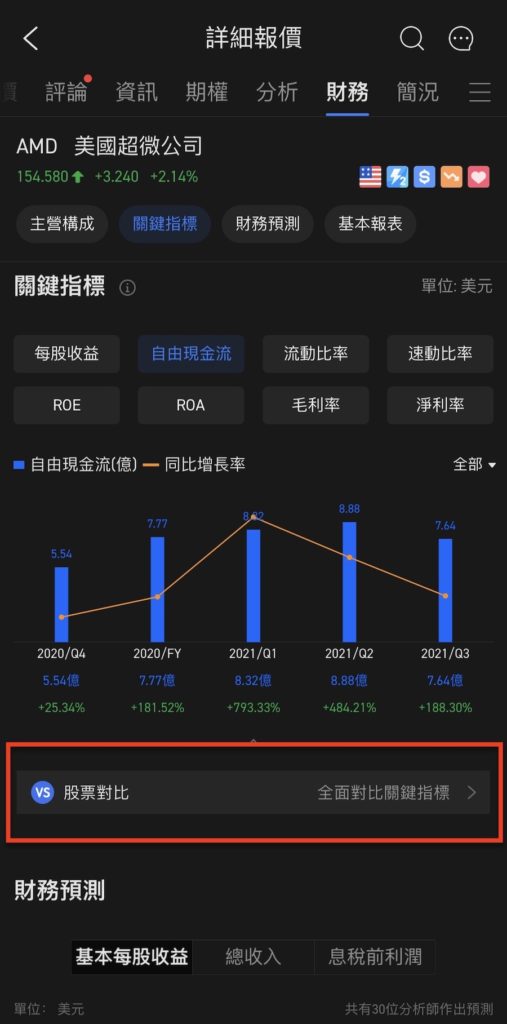
Key financial indicators
When researching and analyzing stocks, the biggest headache for investors is often the large amount of financial data and analyst research reports from companies in various places, which is very energy-consuming to process.
One of Moomoo's features is to provide comprehensive and in-depth financial data on individual stocks, as well as key financial indicators.To understand the fundamentals of the company, just log in to the Moomoo trading platform, and all the company's financial report data will be clear at a glance.
This means that investors no longer have to look around for various information or manually calculate different analytical indicators, and can use the time saved to tap potential stocks.
Moreover, the platform also uses a large number of charts to visualize complex data and turn it into easy-to-digest analytical charts, so that even novices can quickly find relevant data.
Using skills
On the detailed page of individual stocks, click the "Finance" page to view all the financial data of the company and understand the fundamentals.
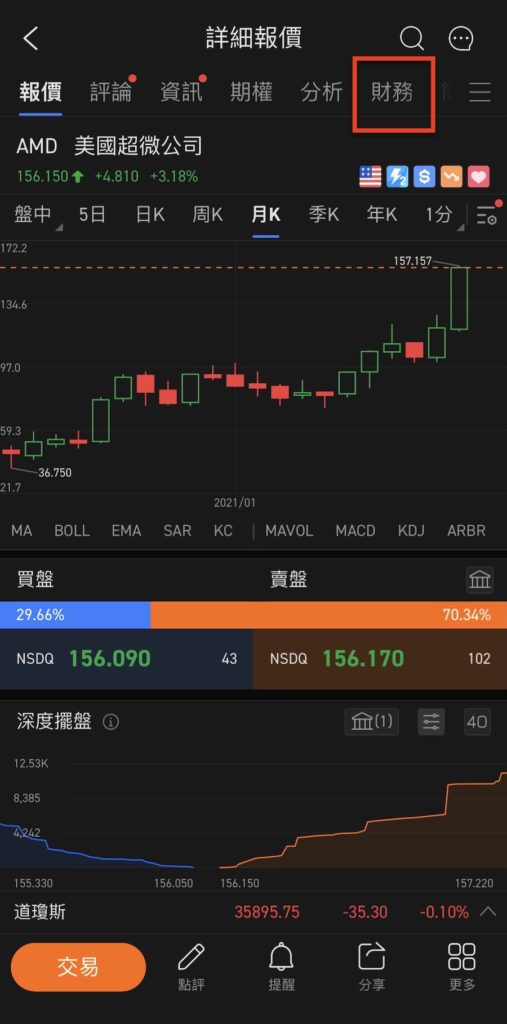
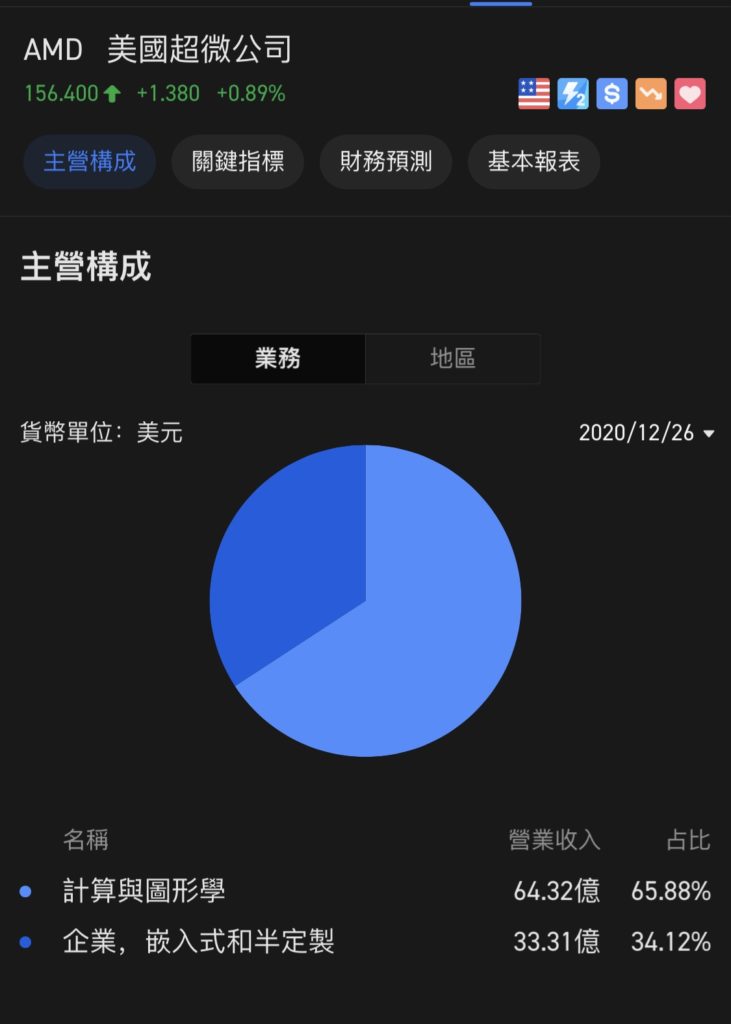
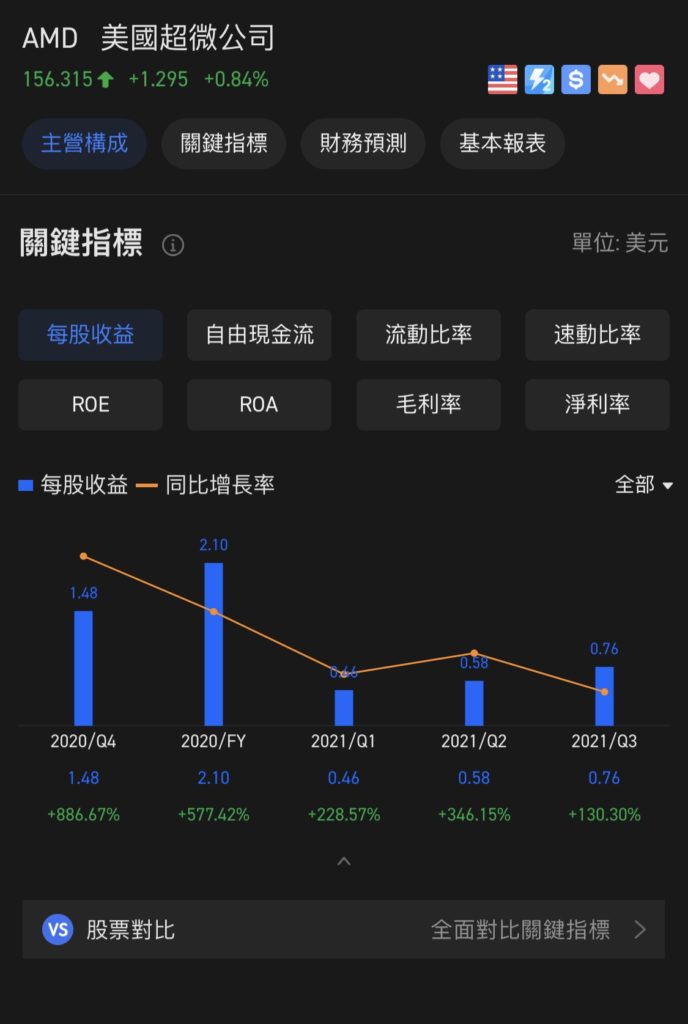
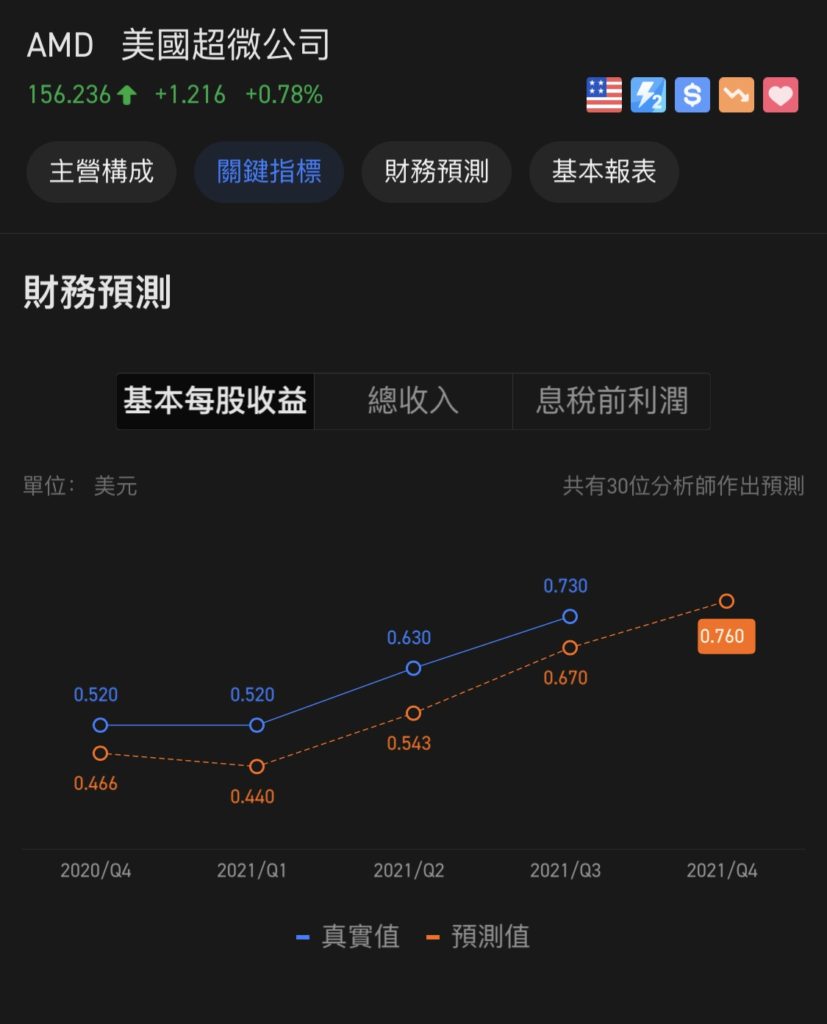
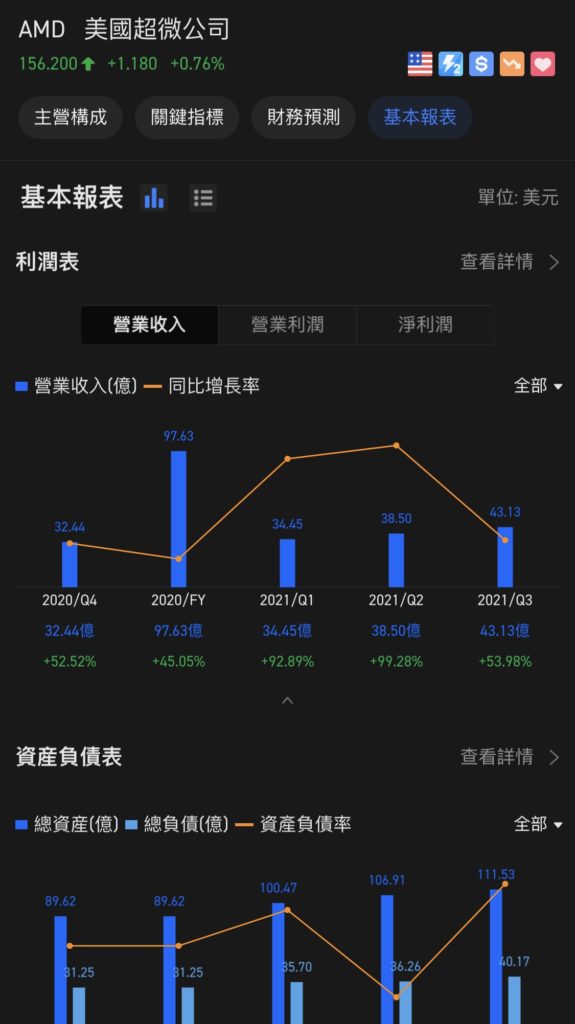
The review of key financial data is divided into four groups: main components, key indicators, financial forecasts and basic statements.
- Main components: Under the three categories of enterprise business segments, main products and regional divisions, the respective operating income and activities can help understand the company's income sources.
- Key indicators: Including net income (earnings per share, EPS), ROE, ROA, free cash flow, gross profit margin, net profit margin and other indicators and their changes over the same period (YoY), you can examine whether a company's financial situation remains healthy.
- Financial forecast: Provide multiple analysts with performance forecasts for EPS, total revenue and EBITDA for the next quarter to help plan the next investment actions in advance.
- Basic statements: Provide detailed data and interpretation of the three major financial statements-income statement (income statement), balance sheet, and cash flow statement for 5 years.Data is presented in both charts and lists.
 |
 |
 |
 |
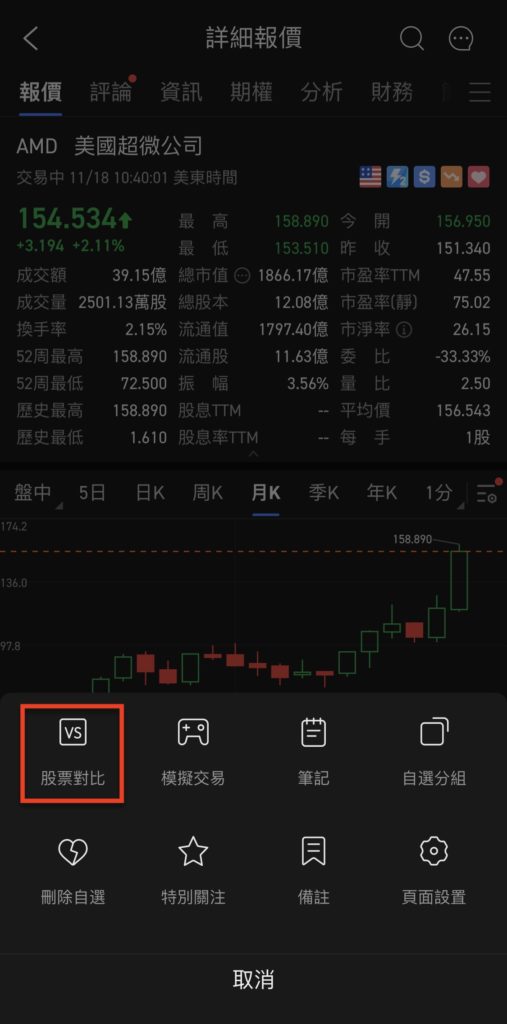
Stock comparisons support comparative analysis between different stocks
In order to facilitate users to compare the differences in key indicators between different stocks, Moomoo launched the "Stock Comparison" function to analyze and compare the performance of different companies in the same industry from five aspects: market indicators, valuation indicators, analytical indicators, financial indicators, and financial data.
- Market indicators: Including the closing price, total market value, trading volume, turnover, etc. of the stock on the most recent trading day.
- Valuation indicators: including EPS, price-to-earnings ratio TTM (P/E), price-to-book ratio (P/B), profitability TTM (dividend yield), etc.
- Analytical indicators: Including the average target price given by analysts, the latest short selling ratio, institutional shareholding ratio, the total shareholding ratio of the top 5 largest shareholders, capital inflows, etc.
- Financial indicators: including ROE, ROA, gross profit margin, net profit margin, receivable turnover rate, etc.
- Financial data: Including operating income, gross profit, foreign exchange, total assets, total liabilities and liabilities of the latest quarter of stocks.
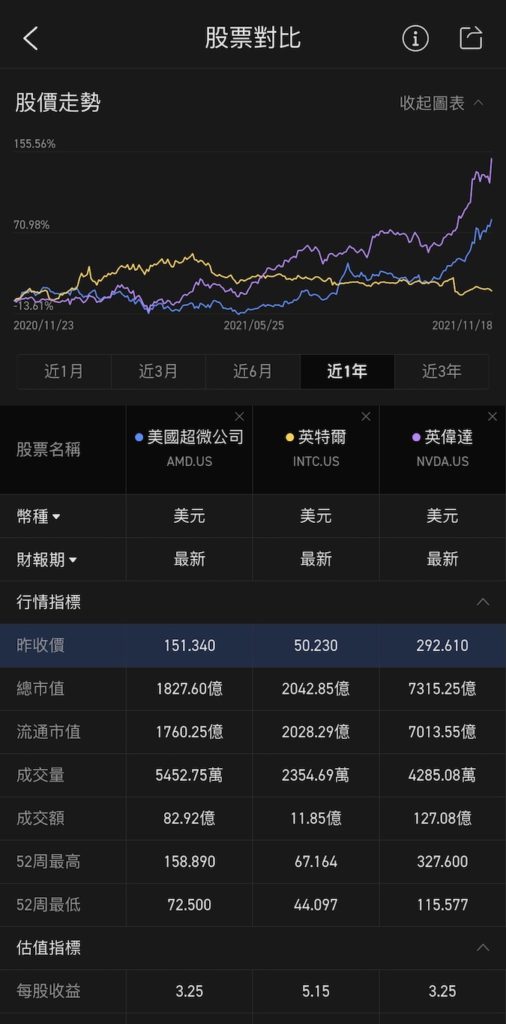
Using skills
On the "Quotation" page of individual stocks, click "More" in the lower right corner to see the "Stock Comparison" link window.
Or on the "Finance" page of individual stocks, under "Key Indicators", you can also see the link window for "Stock Comparison".
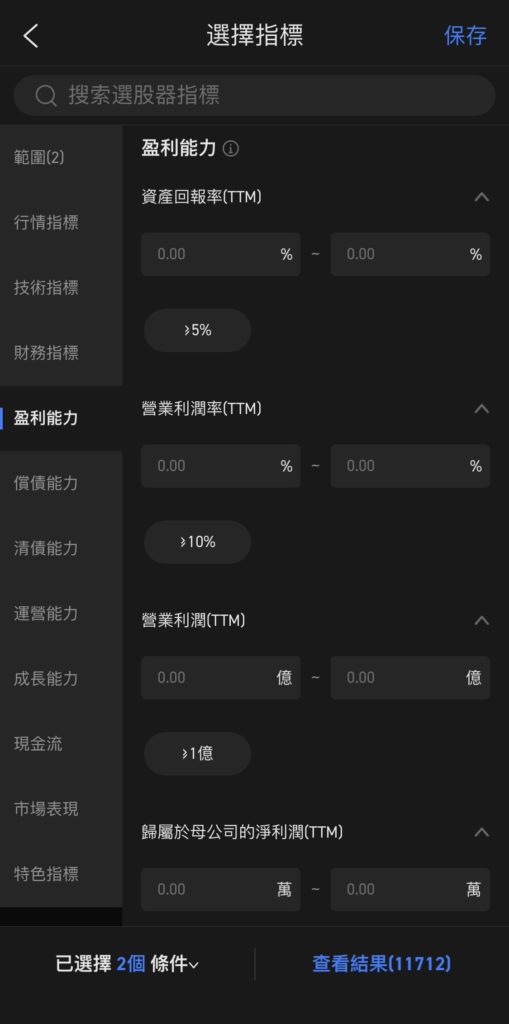
Stock selector
If you want to find potential investment targets, Moomoo provides a "stock picker" function covering 12 aspects and a total of more than 100 data indicators. You can select with reference to technical aspects, industry sectors, market indicators and financial indicators.
Moomoo classifies different financial indicators. In addition to basic indicators (operating income, gross profit margin, net profit margin, etc.), it also relies on profitability, solvency, debt clearing ability, operating ability, growth ability, inspection, market performance, and characteristic indicators to help select stocks that match your investment preferences and have potential.Add it to the list of selected stocks with one click and continue tracking.
Using skills
Click "Opportunities" on the home page, and the link window of "Stock Picker" will be displayed in the functional area above.
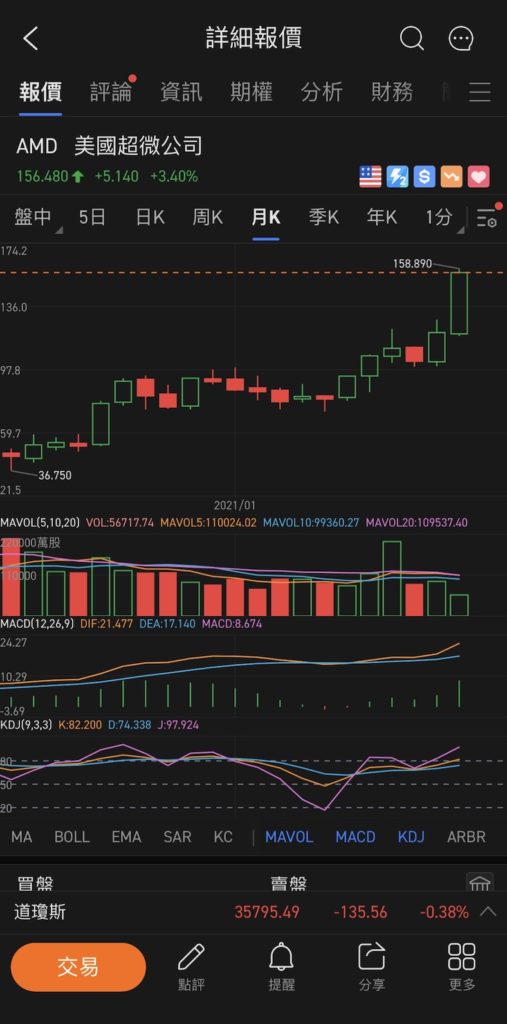
Professional technical analysis drawings and line drawing tools assist in technical analysis
Technical analysis is a commonly used analysis method by many senior investors. Moomoo provides a variety of technical analysis charts and line drawing tools to help investors analyze the historical trend of individual stock prices and determine appropriate entry and exit prices.
Technical analysis indicators include the MAVOL trading volume average, the MACD index smooth and moving average, KDJ stochastic indicator, ARBR sentiment indicator, etc.
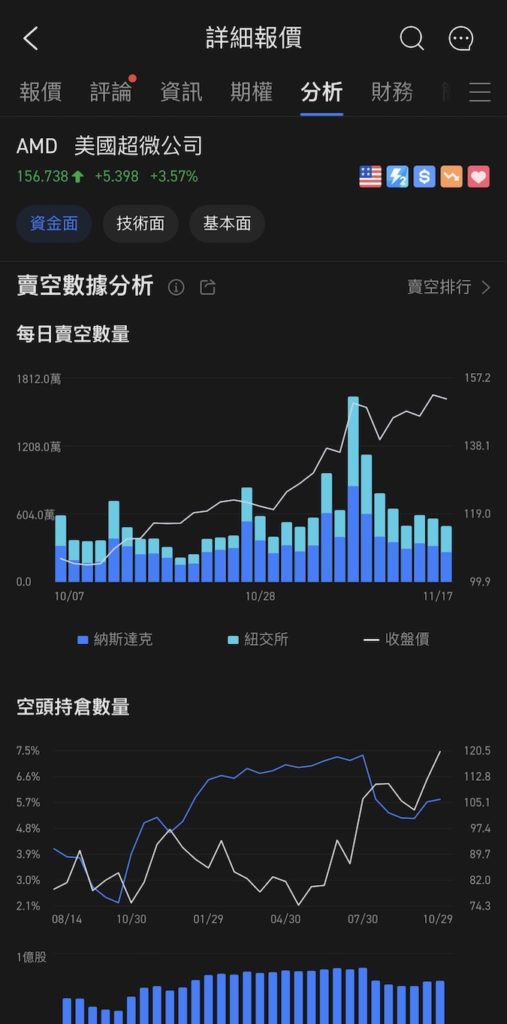
In addition, investors can also identify long-short sentiment in the market and judge stock price trends by observing daily short selling data, short selling ratios, and current short position data of individual stocks.Most brokerages update short selling data once every half a month, and Moomoo is the first broker to support updating short selling data every day.
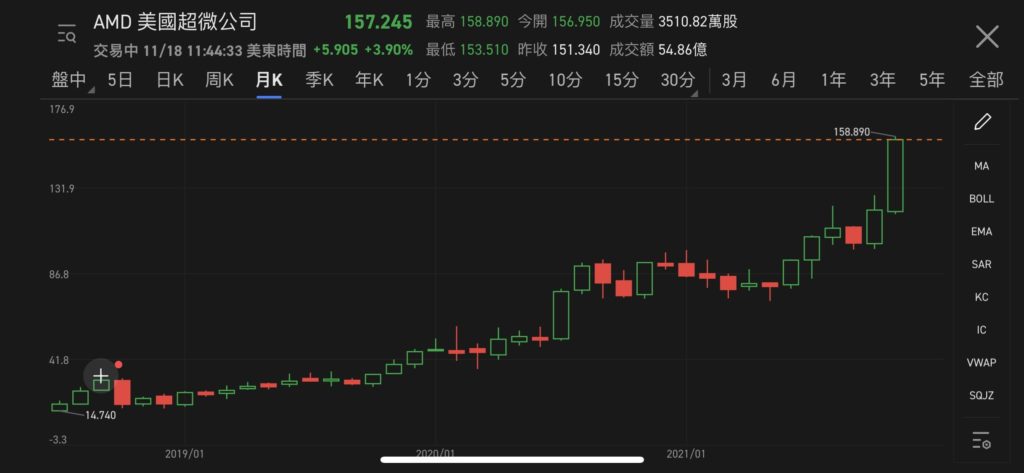
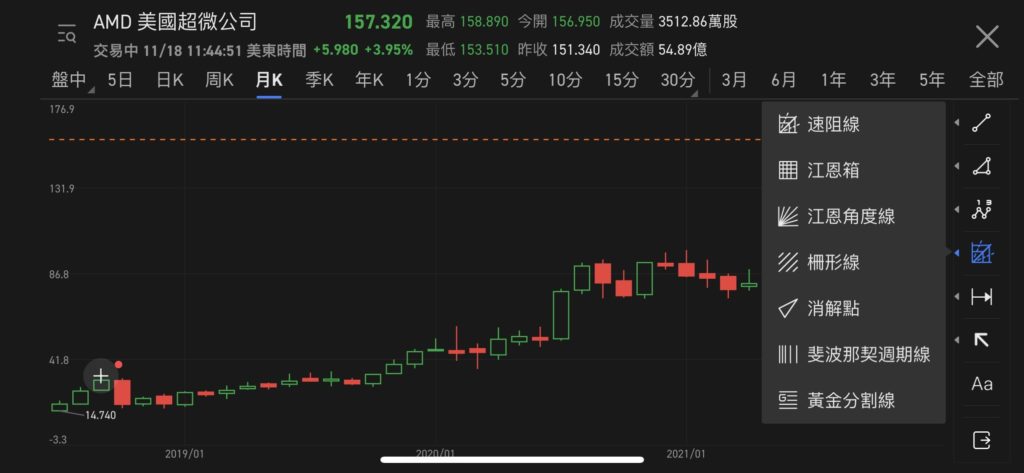
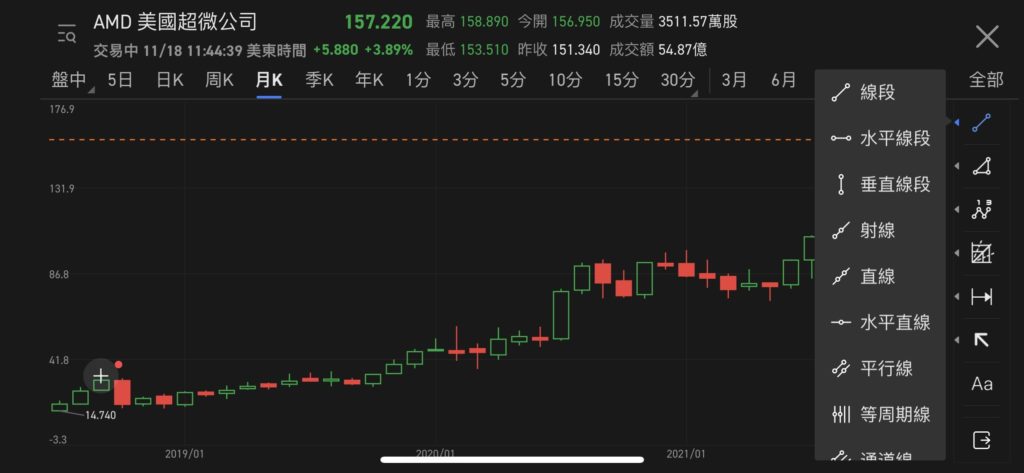
Moomoo has a professional technical line drawing function built in. Just open the line drawing tool for individual stocks to start drawing lines.There are 8 categories of line drawing tools, with a total of 37 line drawing types. By drawing lines, the pattern of the K-line trend is discovered, and the support level, pressure level, upward trend channel, and downward trend channel are accurately determined.
The eight types of line drawing include line segments, outlines, river lines, Gann and Fibonacci tools, space-time ruler, arrow classes, and mark classes. Each line drawing can adjust its own line shape, line details, etc., and can also be stored later. Save in the K line for taking notes.
Using skills
On the "Quotation" page of individual stocks, you can see the link window of "Line Drawing Tool" by the rightmost button of the K-chart chart; or on the left side of the K-chart (double-click), after entering the horizontal screen, you can select Line Drawing Tool in the right toolbar.
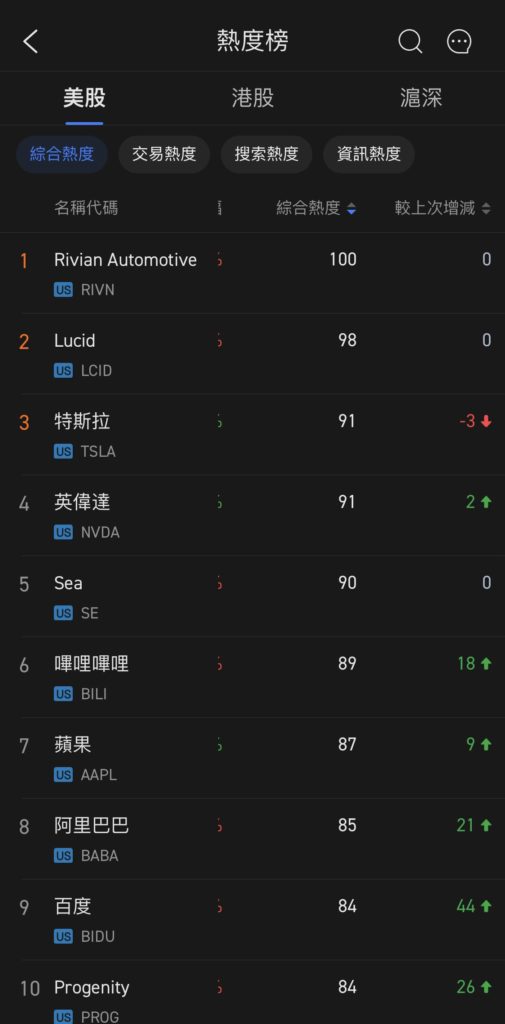
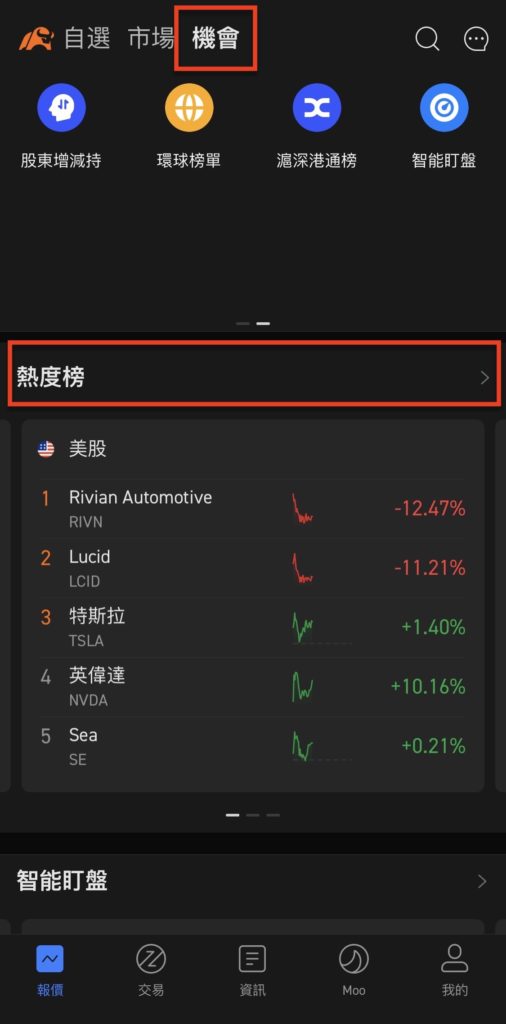
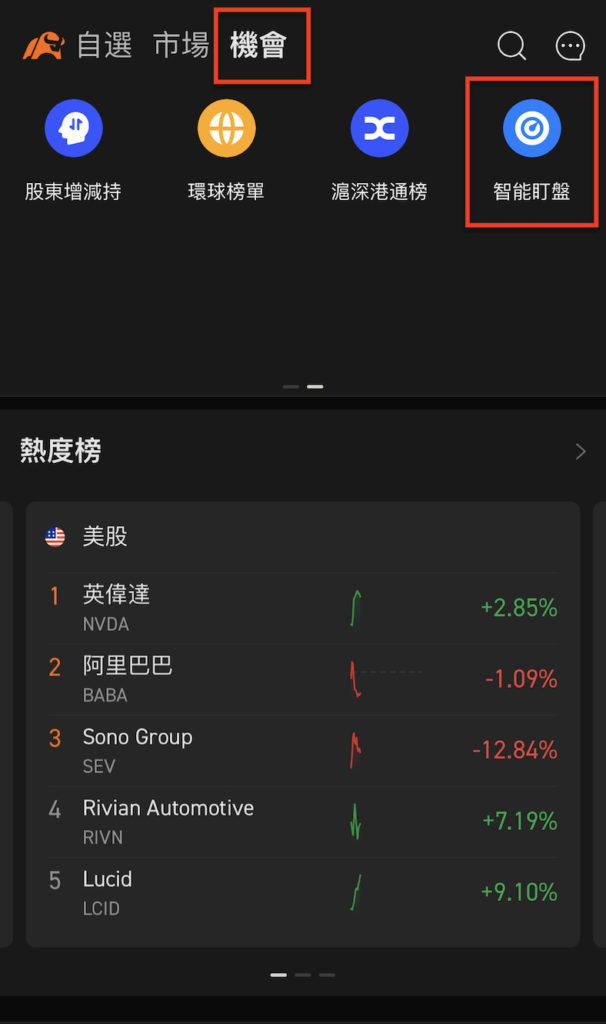
Hot List
In the stock market, the stocks that are sought after and searched for with high popularity are constantly changing every day. Moomoo uses big data capabilities to launch the stock market "popularity rankings." On the popularity rankings of U.S. stocks, Hong Kong stocks, and China A shares, you can see the rankings of the hottest stocks in these markets, helping investors explore investment opportunities.
There are four popularity indicators in the popularity list: comprehensive popularity, transaction popularity, search popularity, and information popularity.
Using skills
Click "Opportunities" on the home page, and you will see the "Hot Ranking" below the functional area. Click> on the right to open a more comprehensive ranking of the rankings.
Heat map
Many people select stocks based on sectors or sectors. Through stock heat maps (heat maps), you can quickly find out which sector is currently the most popular and which stocks are available under the sector or sector for reference.
Heat maps are a popular reading function in the near future. They use the size and color depth of color blocks to show the market trend and activity level, and can also allow investors to feel the current investment preferences and emotions of investors.
The larger the area, the greater the transaction volume (or market value, transaction volume); the darker the color, the greater the increase or decrease.Due to the obvious contrast in plate sizes and color shades, investors can quickly grasp market performance.
Moomoo's "Heat Map" function covers U.S. stocks, Hong Kong stocks, China A stocks and Singapore stocks. Users can use the filtering function to sort them according to market value, trading volume, and trading volume. They can also adjust the number of sectors and the time range of ups and downs.
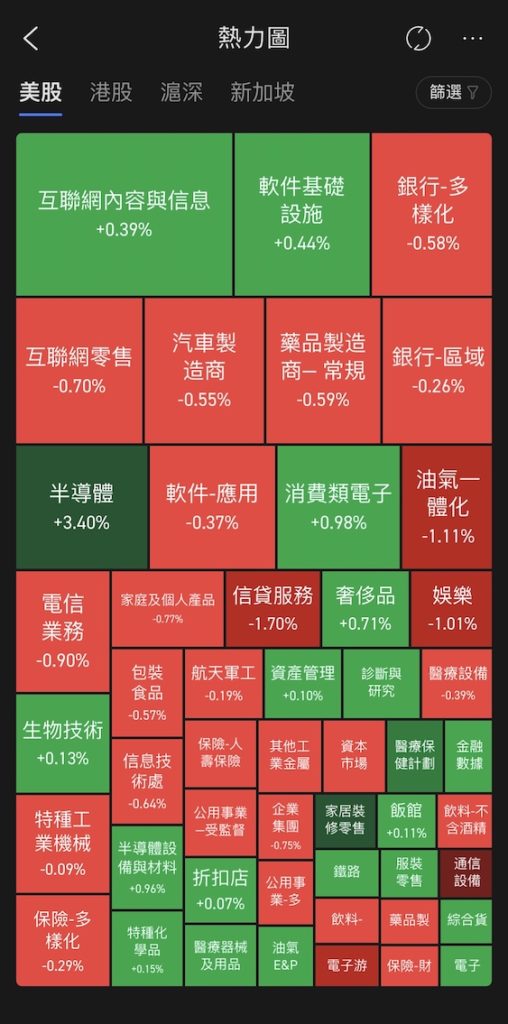
Using skills
Click "Opportunities" on the home page, and the link window of "Heat Map" will be seen in the functional area above.
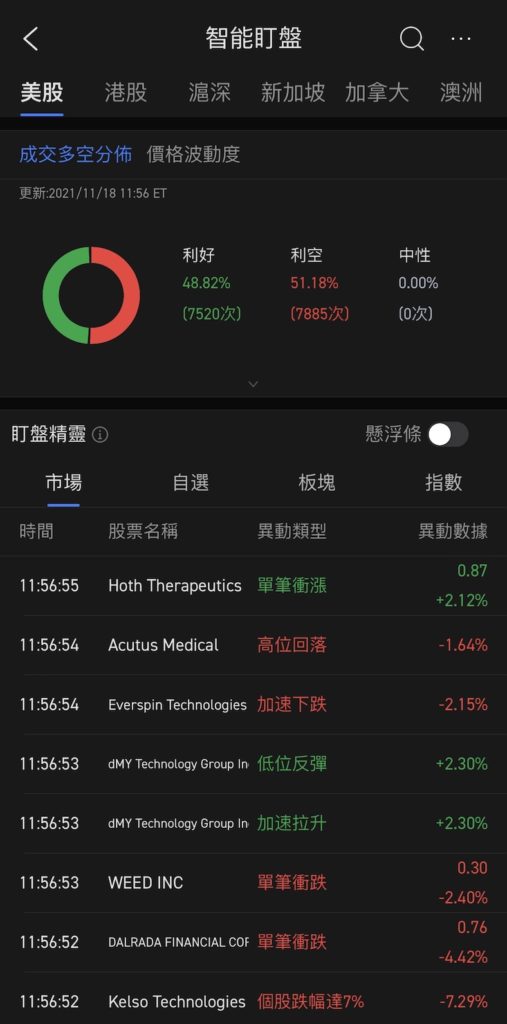
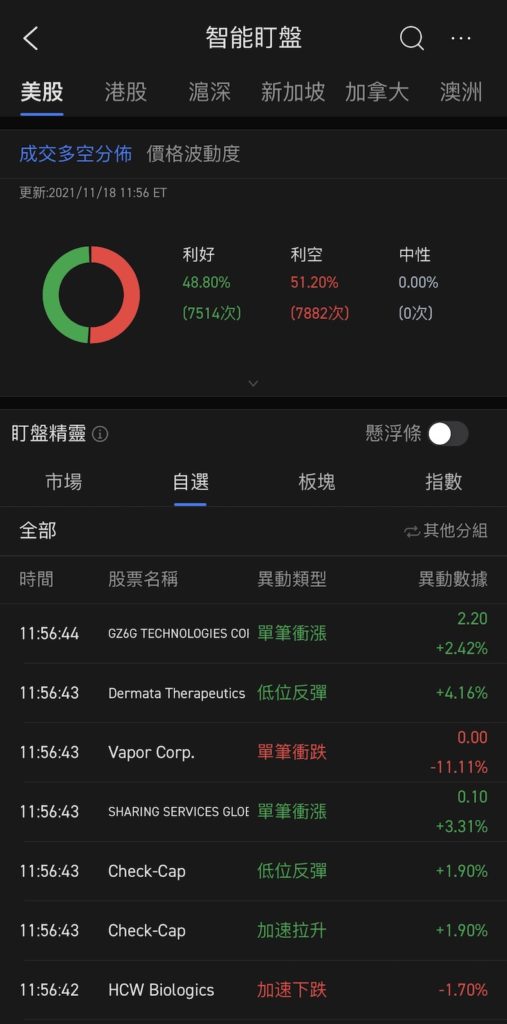
AI smart tracking
The stock market is changing rapidly, but investors cannot always watch the market and pay attention to the ups and downs of individual stocks and abnormal phenomena.Therefore, Moomoo uses AI smart technology to launch the "Smart Tracking" function, which automatically helps investors observe and track changes in different markets. It can also track trading volume and price changes based on a list of stocks of their choice.
Intelligent mark-to-market tracks four major categories: market, optional, sector and index, and can track U.S. stocks, Hong Kong stocks, China A shares, Singapore and other markets.Of course, investors do not need to watch the "smart tracking" at all times. They only need to set up a "message notification" and the system will immediately proactively notify the changes in self-selected stocks.
Using skills
Click "Opportunities" on the home page, and the "Smart Tracking" link window will be seen in the functional area above.
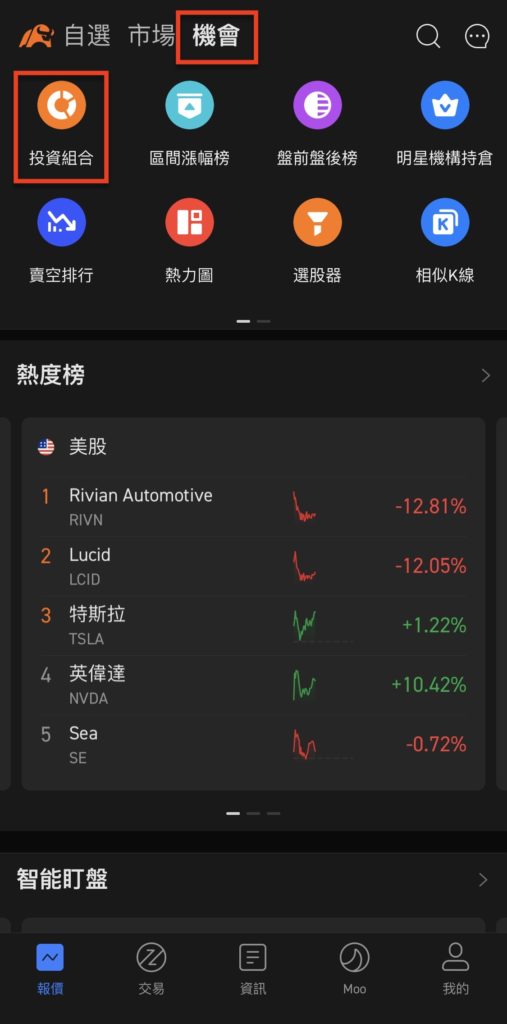
Focus on high-quality investment portfolios and gain investment inspiration
Moomoo has the first "Portfolio" feature that allows users to share their own simulated portfolio data and brings new investment inspiration to other users.Other users can also leave comments and suggestions to exchange ideas.
Portfolio information includes portfolio income (recent three months, recent one year, all), portfolio positions (including cash and shareholding ratio), profit and loss ratio, market and industry distribution, position adjustment history, etc.
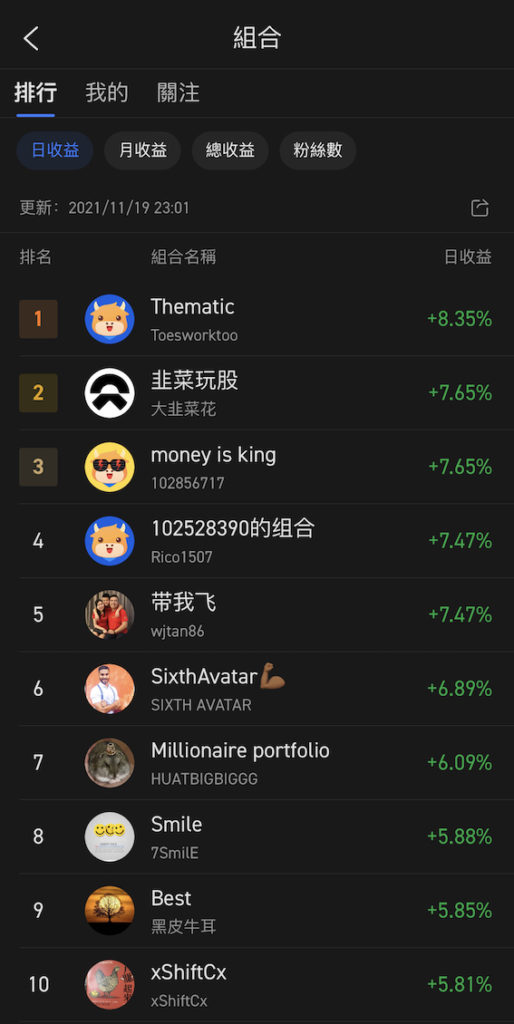
Using skills
Click "Opportunities" on the home page, and the link window for "Investment Portfolio" will be displayed in the functional area above.
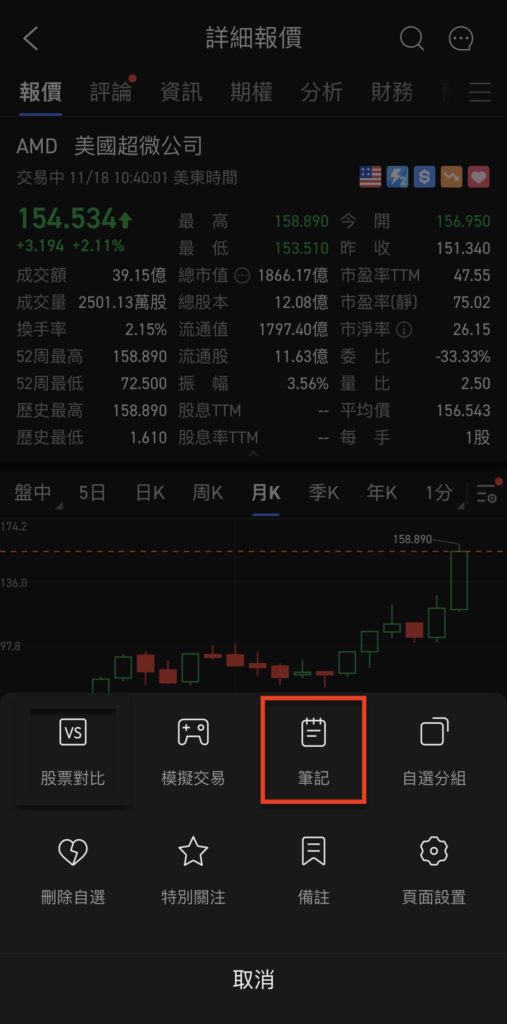
Note function
Moomoo also has an oft-ignored "note taking function" that allows investors to record their thoughts, analysis, and information on individual stocks for later viewing.You can choose to customize the content of your notes, such as today's historical profit and loss, transaction records, order records, total position details, etc.;
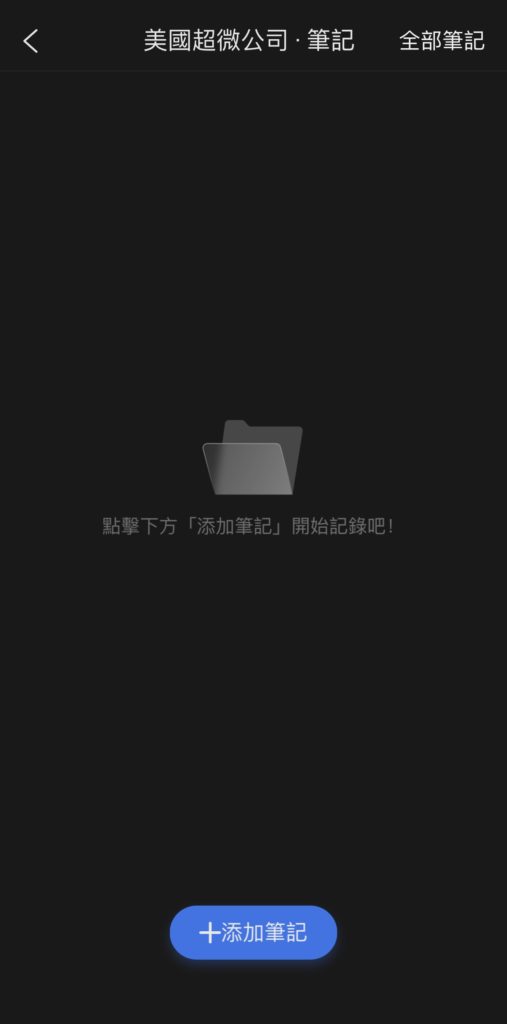
Or select the "Generate Daily Review" template to record the performance of today's investment portfolio, including today's profit and loss, profit and loss ratio, position profit and loss, etc., and summarize the day's investment situation and feelings as a review record of the day's transactions.
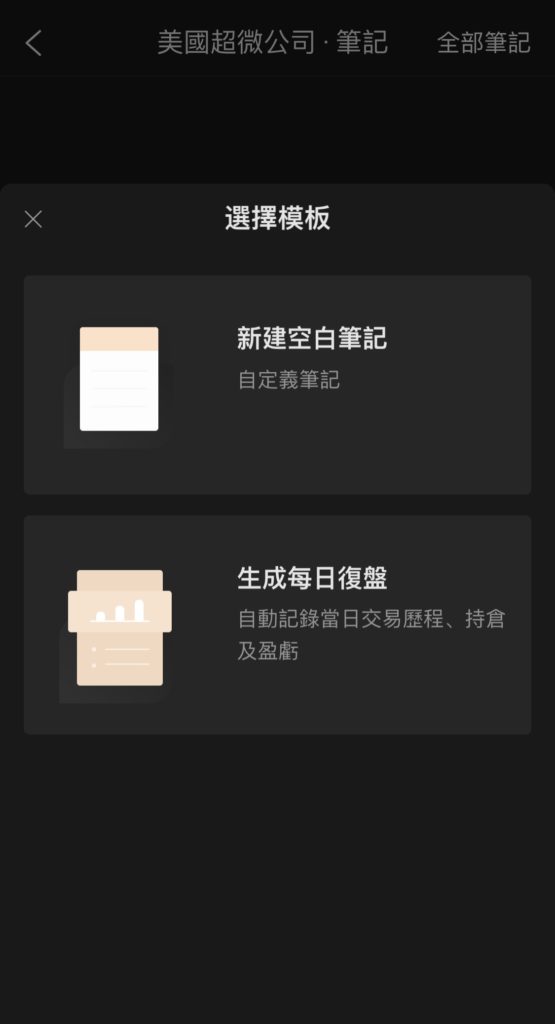
Using skills
On the "Quotation" page of individual stocks, click "More" in the lower right corner to see the "Notes" link window. You can choose to share it in the community or only see it for yourself.
Summary
The Moomoo trading platform hides many useful functions. Whether you are a novice, a short-term trader, or an analysis genre with long-term investment fundamentals, techniques, news or funds, you can use these functions to help invest.Moreover, the Moomoo interface is simple and easy to operate, so I recommend everyone to try it out!
[Related reading] What are the welcome rewards for the rich cow cow (moomoo)?
[Related reading] What are the transaction fees for Moomoo??
[Related reading] How to invest in stocks at Futu Securities (moomoo)?
Disclaimer: The views in this article are from the original Creator and do not represent the views or position of Hawk Insight. The content of the article is for reference, communication and learning only, and does not constitute investment advice. If it involves copyright issues, please contact us for deletion.


_484980626_545.png?w=3840&q=100)


_1857189206_153.png?w=3840&q=100)