What role does the current ratio and the quick ratio play in investing??
What is the significance of the current ratio and the quick ratio value??How to calculate correctly?

Businesses that will make money are always easier for investors to notice。As a result, most investors will focus on reviewing financial indicators such as gross margin, operating margin and net profit margin when screening companies.。
However, no matter how profitable a company is, there is also a risk of failure, which can lead to a financial crisis if it is unable to repay its debts as they fall due or if it fails to turn around, and thus faces the risk of bankruptcy.。
Therefore, when evaluating a company, investors should not only review the financial indicators related to the company's profitability, but also pay attention to its solvency.。
In this article, the author will share with you important indicators related to corporate solvency: "current ratio" and "quick ratio."
What is the current ratio??
Current Ratio (Current Ratio) This indicator is used to assess a company's ability to repay its debts in the short term (within one year) and can also show whether the company is able to meet its short-term debt requirements, so the larger the result of this indicator, the healthier the company's financial position and the better its short-term solvency.。
▍ Calculation formula of current ratio
The calculation of the current ratio shows the relationship between "current assets" and "current liabilities." Simply put, when current assets are greater than current liabilities, it means that an enterprise's ability to repay its debts in the short term is stronger; conversely, when current assets are less than current liabilities, it means that its ability to repay its debts in the short term is worse.。
- Current ratio = (current assets ÷ current liabilities) x 100 per cent
- Current assets: assets that can be realized within one year。For example: cash, inventory, accounts receivable, marketable securities, etc.。
- Current liabilities: Refers to debts due within 1 year.。For example: short-term borrowings, interest, notes payable, etc.。

What is the quick ratio??
Quick Ratio (Quick Ratio) is also a measure of a company's solvency, but the speed ratio is assessed in a more rigorous way than the current ratio.。
Generally speaking, "inventory" and "prepayments" in current assets are considered to be items with poor liquidity, so they will be deducted in the calculation, and only the remaining items that can be realized immediately will be used, and the calculated results will better show the ability of the enterprise to repay its debts in the event of a short-term crisis.。
▍ Calculation formula of quick ratio
The quick ratio is calculated by dividing "quick assets" by "current liabilities," while quick assets are the amount of assets remaining immediately realizable after deducting inventory and prepayments from current assets.。
Since this indicator is calculated in a way that does not take into account inventory and unusable prepayments that cannot be liquidated quickly, it is faster than the current ratio in terms of liquidity.。
- Quick Ratio = (Quick Assets ÷ Current Liabilities) x 100% = [(Current Assets - Inventory - Prepayments) ÷ Current Liabilities] x 100%
- Inventory: refers to the goods accumulated to meet future demand, such as raw materials, components, finished products, semi-finished products, etc.。
- Prepayments: expenses paid in advance by an enterprise, usually in small amounts, and therefore have little impact on the overall calculation.。


▍ Numerical significance of current ratio and quick ratio
Taken together, both the current ratio and the quick ratio are measures of a company's short-term financial risk。
A financially sound business will usually have more current assets than current liabilities, which means that when the business needs money in the short term, it will at least have enough current assets to realize the debt.。
Therefore, if a company's current ratio is less than 100% (current assets are less than current liabilities), the company will usually be considered to be relatively high short-term financial risk, which also implies that the company may have a financial crisis situation.。
So:
- When looking at the current ratio, the numerical result is based on "above 150%," which represents a better financial position and solvency of the enterprise.。
- The quick ratio is generally based on "above 100%," which means that the enterprise has the ability to liquidate immediately in a short period of time and can repay its debts at any time.。
▍ Current ratio and quick ratio use principle
When examining these two financial conditions of an enterprise, the following two principles should be grasped.
-
Principle 1 When evaluating, compare with industry
Because of the different business conditions and characteristics of each industry, when measuring the current ratio and quick ratio of different enterprises between each other, it should be compared with the same industry to make sense, in order to know which enterprise in the same industry is better.。
-
Principle 2 is not that the higher the value, the better.
As mentioned earlier, the current and quick ratios of a company are based on 150% and 100%, so the data results are as high as possible above the benchmark.?
Not so, although high current and quick ratios represent a company's short-term availability of sufficient funds and good solvency.。
But to put it another way, if the ratio of these two data is too high, it also reveals that companies are relatively inefficient in using their funds, have more idle funds, and have conservative investment strategies.
▍ Examples of current ratio and quick ratio
Generally speaking, the solvency of an enterprise can usually be measured by the current ratio and the quick ratio, with 150% and 100% as the benchmark.。
However, enterprises in different industries may affect the results of these two indicators because of their different industrial characteristics, that is, enterprises whose data are not lower than the benchmark value are not included in the inferior enterprises, and the industrial characteristics of the enterprise need to be taken into account in the review.。
For example, the retail industry in U.S. stocks, such as Costco (COST), Walmart Walmart (WMT), Kroger Kroger (KR), Dale's Dollar General (DG), etc., or Taiwan stocks are also retail products, such as Family (5903), Baoya (5904), Unified Super (2912), Li Ying Fang (2911), etc.。
| Stock Name | Indicators | 2021 | 2020 | 2019 | 2018 |
| Costco (COST) | current ratio | 1 | 1.13 | 1.01 | 1.02 |
| Quick ratio | 0.47 | 0.6 | 0.47 | 0.45 | |
| Walmart (WMT) | current ratio | 0.97 | 0.79 | 0.8 | 0.76 |
| Quick ratio | 0.26 | 0.2 | 0.18 | 0.16 | |
| Kroger (KR) | current ratio | 0.81 | 0.76 | 0.76 | 0.78 |
| Quick ratio | 0.23 | 0.15 | 0.14 | 0.14 | |
| Dollar General (DG) | current ratio | 1.21 | 1.14 | 1.55 | 1.43 |
| Quick ratio | 0.26 | 0.07 | 0.1 | 0.13 | |
| The whole family (5903) | current ratio | 0.5 | 0.63 | 0.62 | 0.76 |
| Quick ratio | 0.32 | 0.45 | 0.42 | 0.59 | |
| Baoya (5904) | current ratio | 1.24 | 1.13 | 1.16 | 1.48 |
| Quick ratio | 0.59 | 0.45 | 0.45 | 0.62 | |
| Unified Super (2912) | current ratio | 0.9 | 0.94 | 0.96 | 1.11 |
| Quick ratio | 0.69 | 0.74 | 0.76 | 0.89 | |
| Li Ying Fang (2911) | current ratio | 1.23 | 1.19 | 1.34 | 1.64 |
| Quick ratio | 0.63 | 0.47 | 0.55 | 0.73 |
Such industries usually have a high proportion of accounts payable, as the general road dealer will not pay the supplier until some time after the purchase, so current liabilities generally appear high in such cases, resulting in low values for both the current ratio and the quick ratio, or even below the assessed benchmark value.。
But does this mean that such companies have no room for performance or are not worthy of investors' attention??
In fact, if only based on these two data to list these stocks as unsatisfactory investment targets, such criteria may be too arbitrary, but it is easy to miss Costco, Walmart, Dollar General, Kroger and other companies that have continued to grow in recent years.。
▍ Current ratio and quick ratio in common & difference finishing
| Indicator Name | current ratio | Quick ratio |
| Meaning of indicators | Measuring corporate solvency | Measuring corporate solvency |
| Indicator Description | Assess the ability of a business to meet short-term debt requirements in the short term (within one year) | Compared to the current ratio, the quick ratio is evaluated in a more rigorous way, using only items that can be liquidated immediately, which better shows the ability of the enterprise to repay its debts in the event of a brief crisis. |
| Meaning of data |
The higher the data results, the better the solvency; The lower the data results, the higher the short-term financial risk. |
Similar to the current ratio, the higher the data results, the less financial risk the company has. The lower the data results, the higher the financial risk. |
| Assessment Baseline |
Excellent: above 150% Inferior: less than 100% |
Excellent: More than 100% Inferior: less than 50% |
▍ How to query current ratio and quick ratio?
-
Taiwan Stock Query Method
In the case of Taiwan stock queries, for example, you can go to the following two websites for data on current and quick ratios.
1.Earnings dog
Current Ratio vs. Quick Ratio Data for Taiwan Stocks

Current ratio ranking of Taiwan stocks in related industries and comparison with other companies
2.HiStock Hi Investment

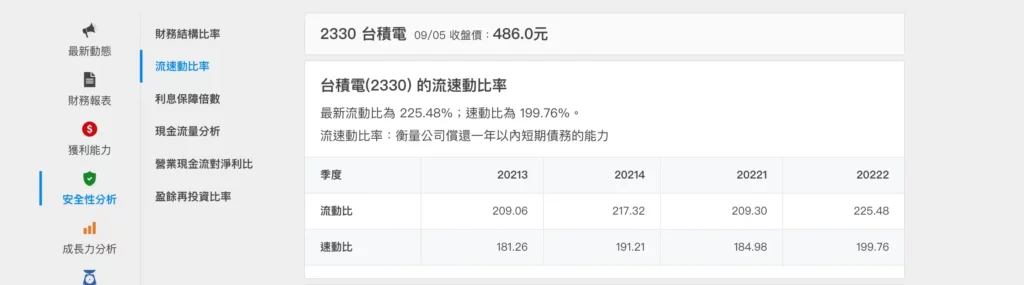
Past current ratio and quick ratio data for Taiwan stocks
-
US Stock Query Method
1. Macrotrends
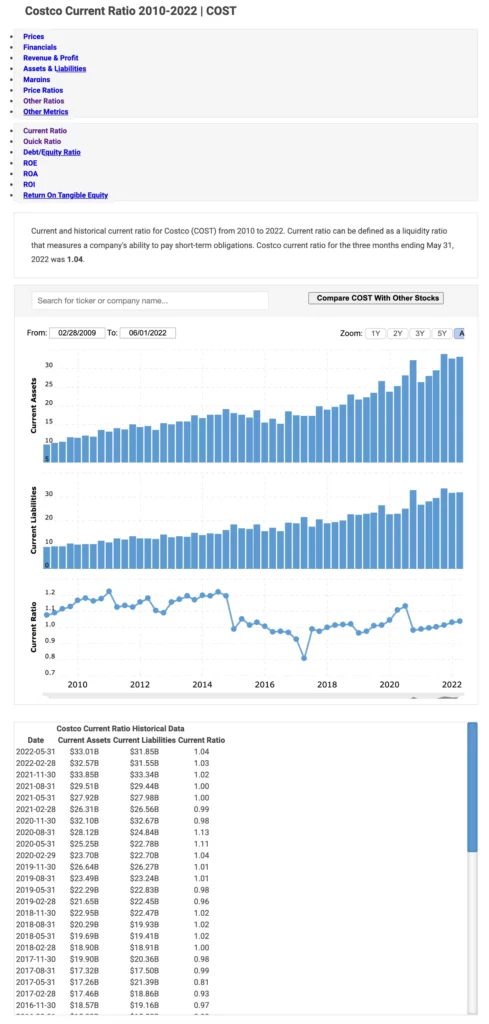
Costco's current ratio data

Costco's Quick Ratio Data
2. Morningstar

Costco's Current Ratio and Quick Ratio Metrics
3. moomoo APP
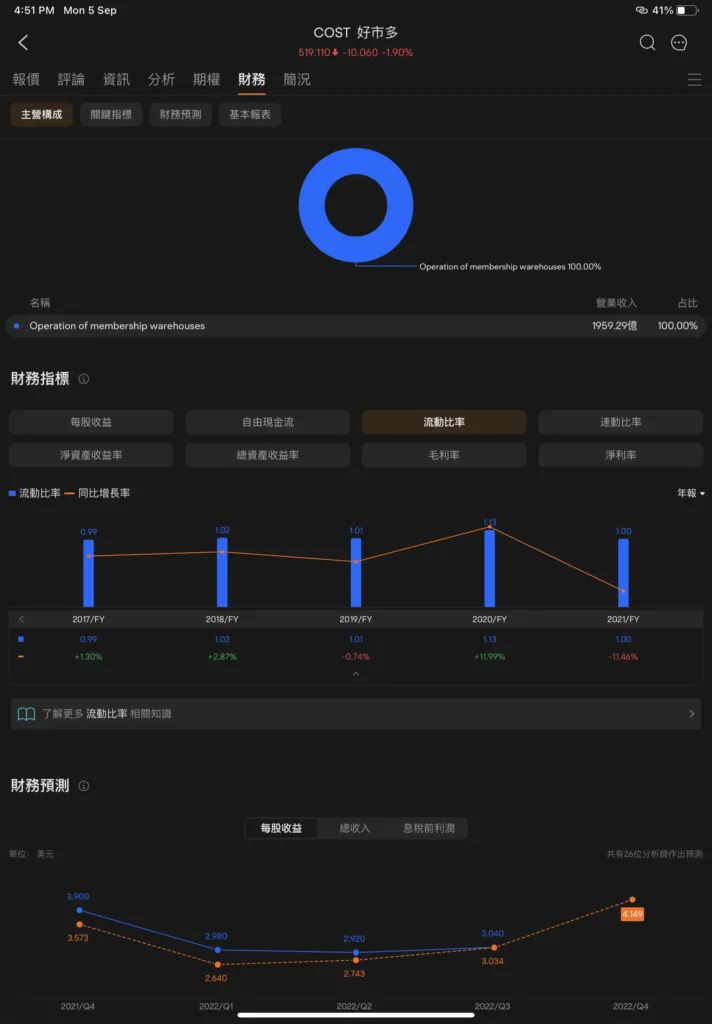
Costco's Current Ratio Indicator
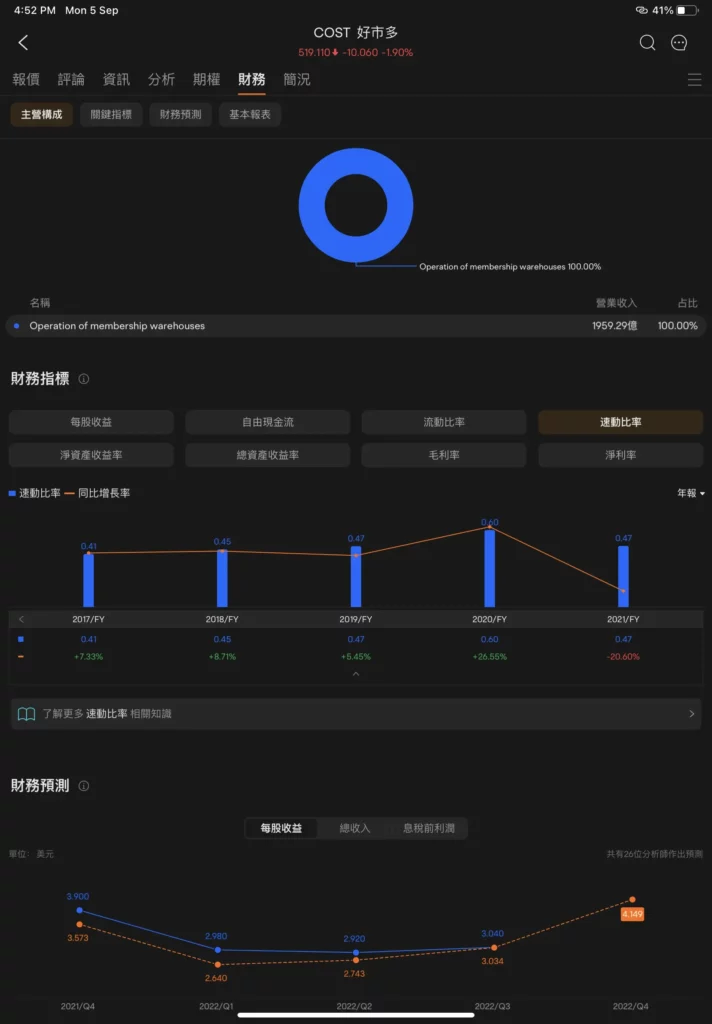
Costco's Quick Ratio Indicator
▍ Summary
Investors in the investment, will give priority to understand the financial situation of the enterprise itself, in addition to the company's profitability, solvency should also pay more attention to。If a company's own current ratio and quick ratio are below the benchmark value, its solvency is weak and investors should consider it more.。In addition, in addition to these two metrics, investors can also view the income statement and balance sheet to gain a better understanding of the company's financial position so as not to fall into the busy spot caused by using a single metric。
·Original
Disclaimer: The views in this article are from the original Creator and do not represent the views or position of Hawk Insight. The content of the article is for reference, communication and learning only, and does not constitute investment advice. If it involves copyright issues, please contact us for deletion.