What does the Fear and Greed Index have to do with the stock market??
What does the fear and greed index and value represent??composed of what?How to query?What does it have to do with the market??

When COVID-19 swept the world in 2020, many countries implemented strict epidemic prevention measures and the overall economy came to a near standstill。During February-March, the S & P 500 suffered a severe setback, with investors selling stocks to stop losses.。
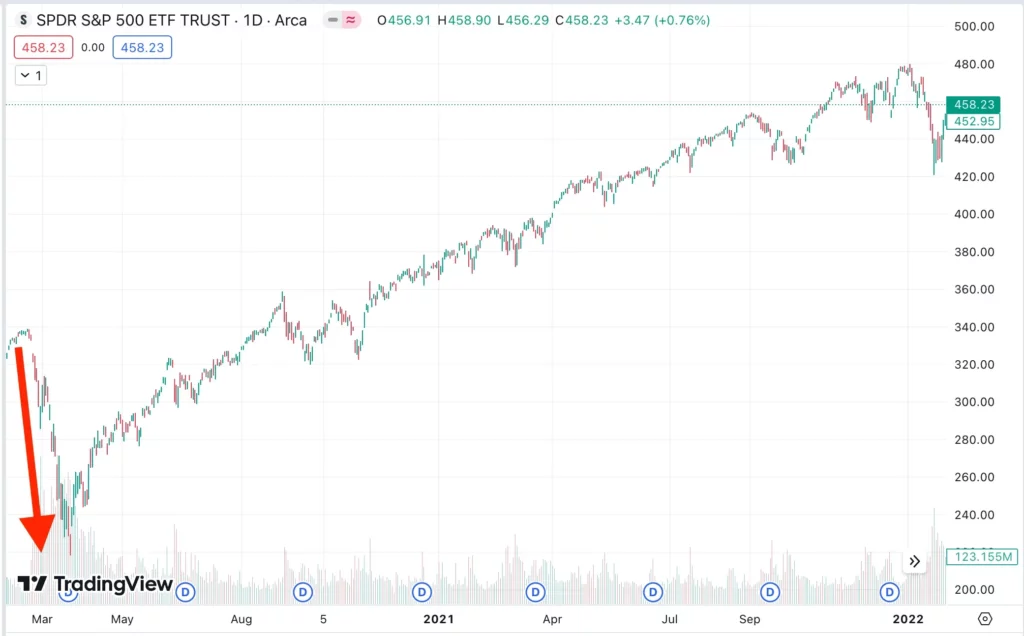
The decline did not put the market into a bear market for too long, but the market has been climbing in a short period of time, the S & P 500 also hit a record high in early 2022。

Recall that during that period, even unfamiliar people around the investment began to follow the trend of investment, even the company did not study to invest money, for fear of missing the opportunity to "make a lot of money."。
Warren Buffett's wise words: "I'm greedy when others are afraid, and I'm afraid when others are greedy."。"is one of the famous investment principles。In the case of the stock market crash in early 2020, we can clearly see that it is a state of "fear."。
But how do you know what state the market is in today??How serious is the fear??How much greed??
The author of this article will take you to the "Fear & Greed Index (Fear & Greed Index)," so that you can understand what the value of this index represents, what it consists of, how to query it, and the relationship between the index and the market.
What is the Fear and Greed Index??
The Fear & Greed Index is a measure of investor "greed" and "fear" developed by CNN Money.。
- When investors begin to show greed, the stock price is prone to overshoot, in which case the stock price is prone to be bid up very high。
- When investors begin to show fear, the stock price usually falls below what it should normally be, and we should pay attention to whether there is an opportunity for the stock price to be undervalued and emerge as a buy value.。
The Fear and Greed Index, unlike the S & P 500, Dow Jones, and Nasdaq, is made up of a variety of components, but is based on statistical changes in investor sentiment in the stock market and is weighted with seven indicators to calculate the Fear and Greed Index, which are.
- Junk bond demand
- market kinetic energy
- market volatility
- stock price width
- Safe haven demand
- Put and Call Options
- stock price strength
What does the fear and greed index represent??
The fear and greed index ranges from 0 to 100, and the closer the value is to 0, the more fearful the investor sentiment in the market is.。And the closer the value is to 100, the more greedy the investor sentiment in the market is.。
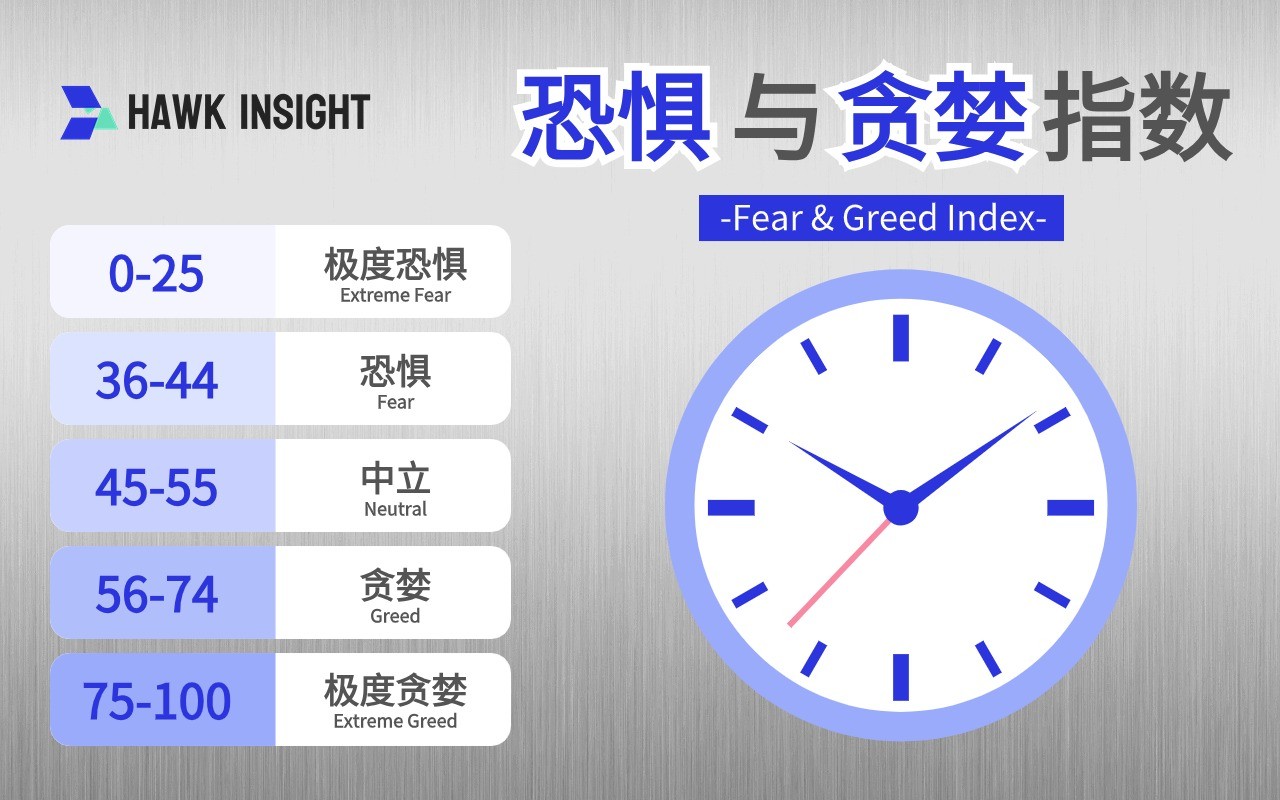
Thus, the results of this data can be subdivided into five states: extreme fear, fear, neutrality, greed, and extreme greed.。
- 0-25: Extreme Fear
- 26-44: Fear
- 45-55: Neutral
- 56-74: Greed
- 75-100: Extreme Greed
For example, on December 8, 2023, you can see that the data result shows "65," which means that the sentiment of investors in the market is biased towards greed.。

—— Screenshot taken from CNN
The 7 indicators that make up the Fear and Greed Index
-
Junk Bond Demand

The junk bond demand indicator is measured by the spread between "junk bonds (high yield bonds)" and "investment grade bonds."。
When the market is in a "panic" situation, the market is worried about the risk of default on junk bonds, so yields rise (prices fall) and spreads widen;
-
Market Momentum
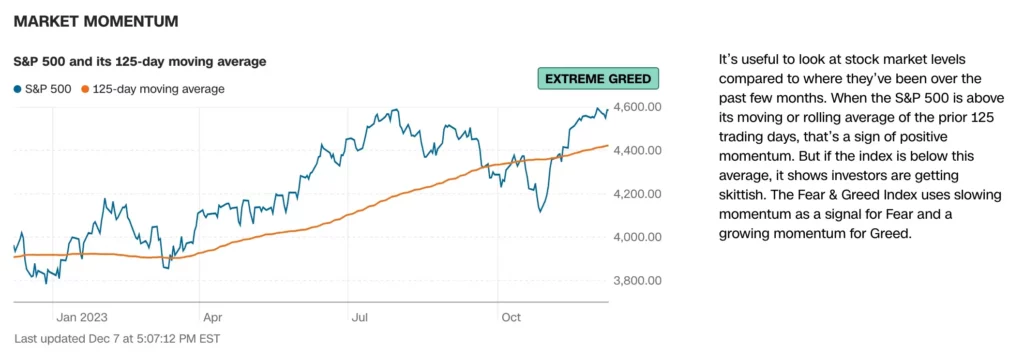
The market momentum indicator is a comparison of the S & P 500 with its 125-day moving average (125 MA) to derive the degree of deviation between the two。
The more the S & P 500 is above the 125-day moving average, the more "greedy" investor sentiment is; conversely, the more the S & P 500 is below the 125-day moving average, the more "panicky" sentiment is.。
-
Market Volatility
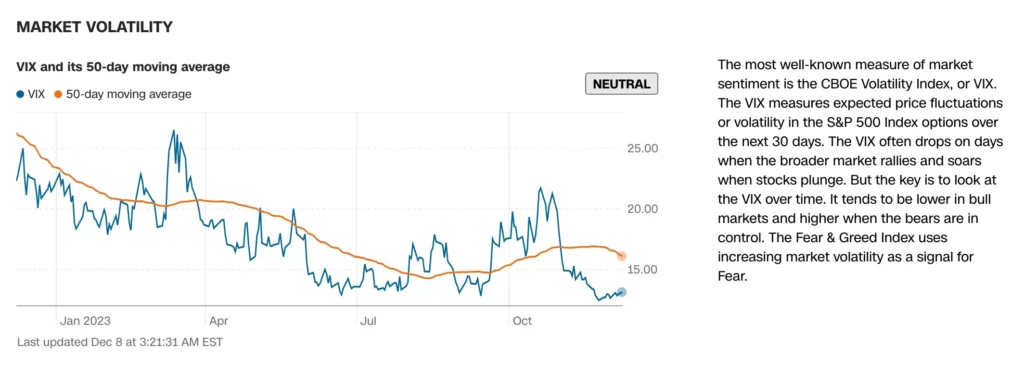
Market volatility is measured by the Chicago Board Options Exchange Volatility Index VIX (also known as the Panic Index) and the 50-day moving average (50 MA) of the VIX, with higher values representing more "panicked" market sentiment and lower values representing more "greedy."。
-
Stock Price Breadth

The stock price width indicator measures the total volume of stocks that have risen versus the total volume of stocks that have fallen over the past period of time based on the McClellan Volume Summit Index (McClellan Volume Index).。
If the total volume of the rise is larger, the more "greedy," if the total volume of the fall is larger, the more "panic"。
-
Safe Haven Demand

The safe haven demand indicator means that when market risk increases, funds will be transferred to safe haven commodities, such as bonds, gold, cash, etc., so this indicator is based on the difference in compensation between stocks and bonds as a judgment.。
When the stock reward is higher than the bond reward, it means that the market is more "greedy";。
-
Put and Call Options
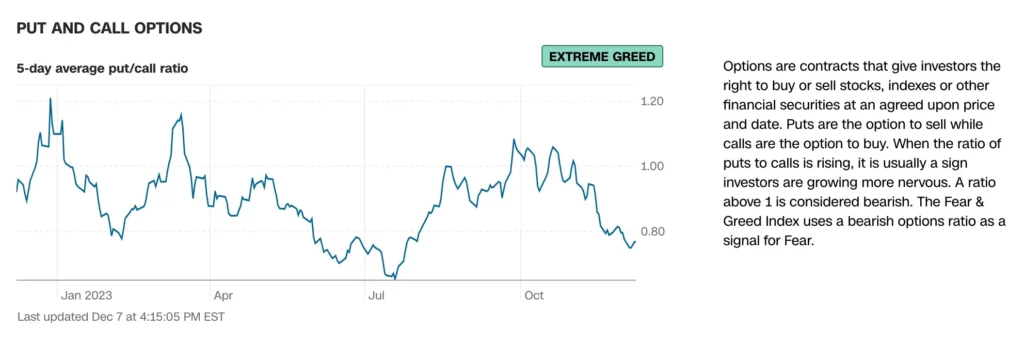
The put call option indicator is based on the ratio of the put put put (Put) trading volume to the call buy (Call) trading volume in the market, when the Put / Call Ratio value result is larger, the higher the put put (Put) trading volume, indicating that the market is more inclined to "panic";。
-
Stock Price Strength
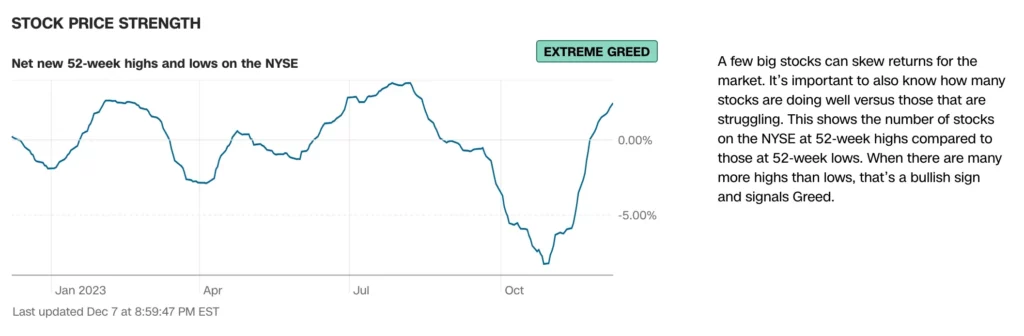
The stock price strength indicator is based on the number of stocks that hit a 52-week high compared to the number of stocks that hit a 52-week low of all stocks listed on the New York Stock Exchange.。
When the number of new highs exceeds the number of new lows, it represents "greed"; otherwise, it represents "panic."。
What do the 7 indicators represent??
The relationship between the values of the seven indicators of the combined fear and greed index and "greed" and "panic" is shown in the following table.
| Indicators | Compare content | Greed | Fear |
| Junk bond demand | bond spread | The smaller | The bigger |
| market kinetic energy | Deviation of the S & P 500 from its 125-day moving average | The greater the degree of deviation | The smaller the degree of deviation |
| market volatility | The VIX index compared to the 50-day moving average of the VIX | Lower | The higher |
| stock price width | Total volume of rising stocks and total volume of falling stocks | The higher the total volume of rising stocks | The higher the total volume of falling stocks. |
| Safe haven demand | Difference between stock and bond returns | The more stock yields are higher than bond yields | The more bond yields are higher than stock yields |
| Put and Call Options | The ratio of put (Put) trading to call (Call) trading volume. | The lower the value | The higher the value |
| stock price strength | Record High and Record Low Number of Stocks | The greater the number of new highs | The lower the number of innovations |
The relationship between the fear and greed index and the stock market?
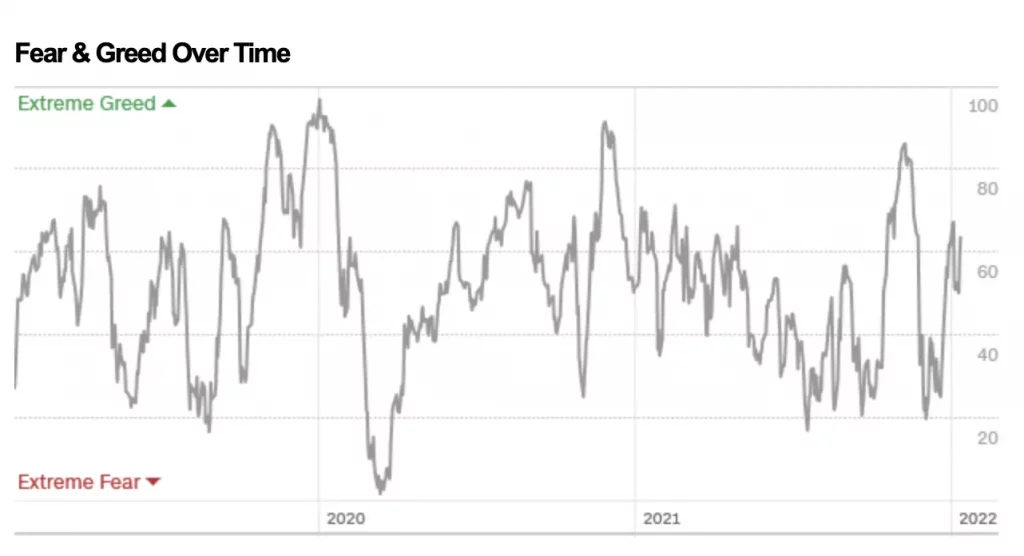
Looking at the period from 2019 to 2021 when the Fear & Greed Index (Fear & Greed Index) fell below 25 (extreme panic), which occurred during the 2020 neo-crown outbreak, shows that the sentiment of market investors was very panicked at the time。
However, after the epidemic caused a sharp correction in global stock markets, countries scattered money, the U.S. Federal Reserve System (FED) in the implementation of quantitative easing (QE), the influx of funds into the market, so that the four major U.S. stock indices continue to hit high out of a wave of big market。
The fear and greed index in the end of 2020 and the second half of 2021 have been the index showed "extreme greed (> 75)" situation, if investors see this situation and think that the stock market has overheated to sell stocks, but will miss the latter part of the market.。
▍ How to query the latest fear and greed index data?
The Fear and Greed Index can be queried on the CNN Money website, and the data results are updated daily。
▍ Cryptocurrencies also have fear and greed index?
Yes, cryptocurrencies also have the Fear and Greed Index (Crypto Fear & Greed Index)。Like the stock market's fear and greed index, a score of 0 means "extreme panic" and a score of 100 means "extreme greed."。
On December 8, 2023, you can see that the data result shows "72," which means that the sentiment of investors in the market is biased towards greed.。
To see the latest cryptocurrency fear and greed index, check out the Alternative website。

Unlike the fear and greed index of the stock market, the indicators used to measure the fear and greed index of cryptocurrencies are:
- Volatility: measures the volatility of Bitcoin against the "Max Drawdown" and compares it to its average over the past 30 and 90 days.
- Market Momentum / Volume: measures cryptocurrency market volume and compares it to its average over the past 30 and 90 days
- Social Media: Measuring the discussion of cryptocurrencies on social media
- Survey: Using Strawpoll.com conducts weekly market research to measure voting results (this project is currently suspended)
- Dominance: Measuring Bitcoin's dominance as a safe haven in the market
- Trends: A summary of data measuring the search volume of Bitcoin in Google Trends
▍ Summary
The Fear and Greed Index does quantify market investor sentiment to some extent and assists investors in investing, but the authors argue that it must be used in conjunction with other technical indicators to make more accurate judgments.。
·Original
Disclaimer: The views in this article are from the original Creator and do not represent the views or position of Hawk Insight. The content of the article is for reference, communication and learning only, and does not constitute investment advice. If it involves copyright issues, please contact us for deletion.